Tag Management - Provider and Virtual Tags
On the Tags page, you can view all tags, including both provider and virtual tags. From the top navigation, click Settings. On the left navigation, under General Settings, click Tags. Four tabs are displayed: All Tags, Virtual Tags, Preferred Tags, and Hidden Tags.Tag Badges
Virtual tags may display badges next to the tag name to indicate special properties:- Allocated badge
- Collapsed badge
The allocated badge (calculator icon) appears when a virtual tag contains cost allocations, such as Business Metrics-Based, Cost-Based, or Percent-Based allocation tags. This indicates that the tag is used to allocate costs across teams, projects, or other organizational entities.
Tag Management Options
Within the tag settings, you can hide tags, mark tags as preferred, or view a tag on a Cost Report.Hide Tags
From the Tags page, you can hide tag keys that you don’t want to appear in report filters or grouping options. This is useful for removing redundant tags or preventing other users from seeing certain tags in reports. To hide a tag key, click the eyeball icon next to the tag on the All Tags tab. As soon as a tag key is hidden, the following changes occur in Vantage:- Hidden from report menus: The tag key is no longer displayed in the Filters or Group By menus on reports for other Vantage users; however, users with the Organization Owner role can still manage tag visibility (i.e., unhide the tag) via the Tags screen.
- Existing reports remain functional: If a report was already filtered or grouped by the hidden tag, it will continue to work, but if you edit the report’s filters, the hidden tag will no longer be available in the filter’s selection list.
- Usable in virtual tags: Hidden tags can still be used when creating virtual tags and will appear in virtual tag filters. If a hidden tag is included in a virtual tag’s filter criteria, a message is displayed next to it, indicating that it is hidden and only usable for virtual tag creation.
- Still accessible via API: Hidden tags remain available through API requests.
You are working to clean up your tagging and notice that teams have applied multiple variations of the same environment-related tag key across different AWS resources: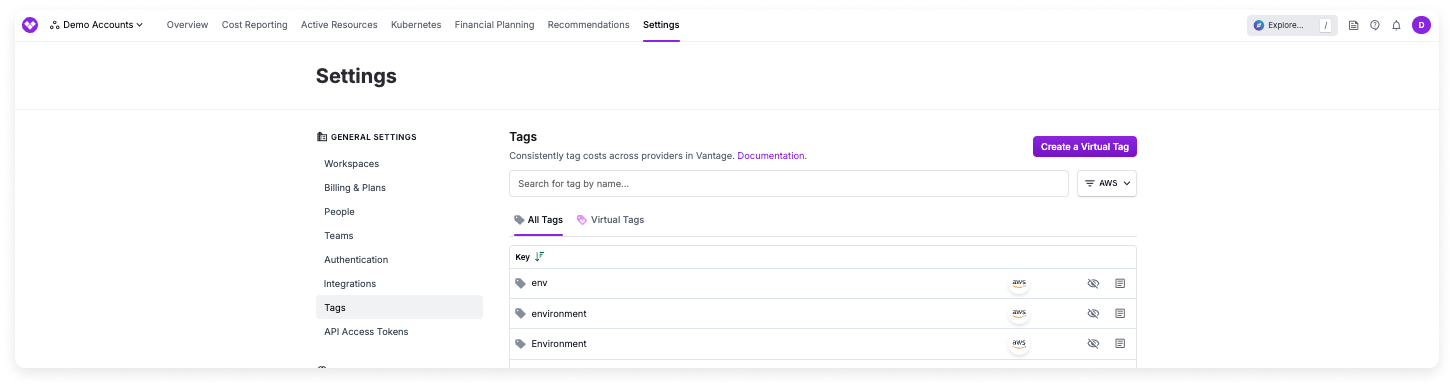
 As a result, your users now see only the
envenvironmentEnvironment
- You navigate to the Tags page in Vantage to search for and identify the different versions of the environment tag. You then hide each iteration of this tag so that you can create a new standardized version of the tag with Vantage virtual tags.
- All three hidden tags no longer appear in the Filters and Group By menus for other users.
- Existing reports that were already filtered or grouped by these tags remain functional; however, if a user edits the report’s filters, they will no longer see those hidden tag variations.
- The hidden tags are still available via API requests, so any external automation using them still continues to work.
- Create a new virtual tag named
environment - In the Collapsed Keys tab, add
env,environment, andEnvironmentas collapsed keys - Vantage will automatically merge all values from these tag keys into your
environmentvirtual tag
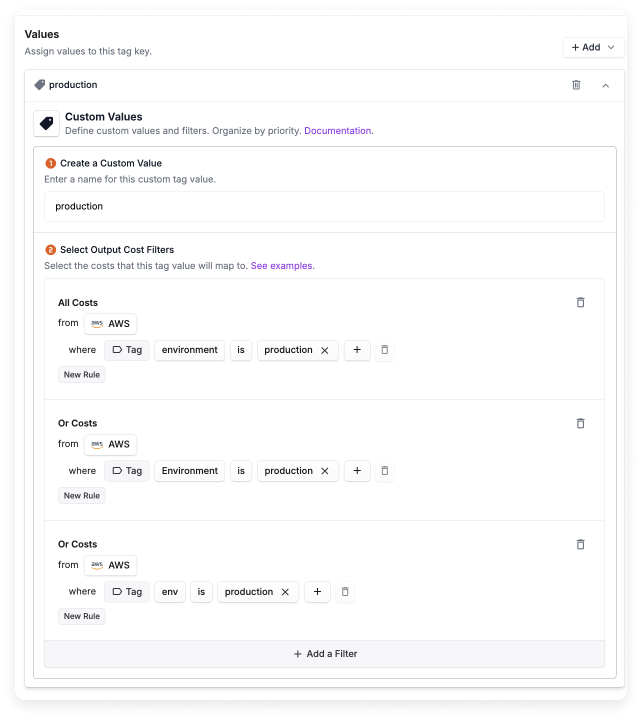
- Create a new virtual tag named
environmentthat consolidates all three variations from the AWS provider tag - For each tag value (e.g.,
production,development, etc.), create a separate filter that combines that specific value from all of the previous tag keys, and repeat this for each tag value you care about. You can then use this new virtual tag within reports
environment virtual tag in their report filters, reducing confusion and keeping reports standardized. This approach helps enforce tagging consistency without you having to further educate your users on which versions of a tag key to use in reports.Preferred Tags
From the Tags page, you can mark tag keys as “preferred” so they are sorted to the top of every tag filter, group-by menu, and tag selector across Vantage. This is useful when your organization has dozens or hundreds of tag keys, but teams regularly use the same handful—such asenvironment, team, or cost-center—for the majority of their workflows.
Marking tags as preferred requires Organization Owner or Integration Owner permissions in Vantage. See the Role-Based Access Control documentation for details.
- Sorted to the top of tag selectors: Preferred tags appear first in Filters and Group By menus on Cost Reports, Resource Reports, Financial Commitment Reports, Cost Recommendations, and other tag selectors across the platform, with a bookmark badge for visual identification.
- Account-wide: When a tag is marked as preferred, all users in the account see it sorted to the top.
- Independent from hidden tags: Preferred and hidden are independent settings. Hidden tags are excluded from filter menus regardless of preferred status.
View Tags on a Cost Report
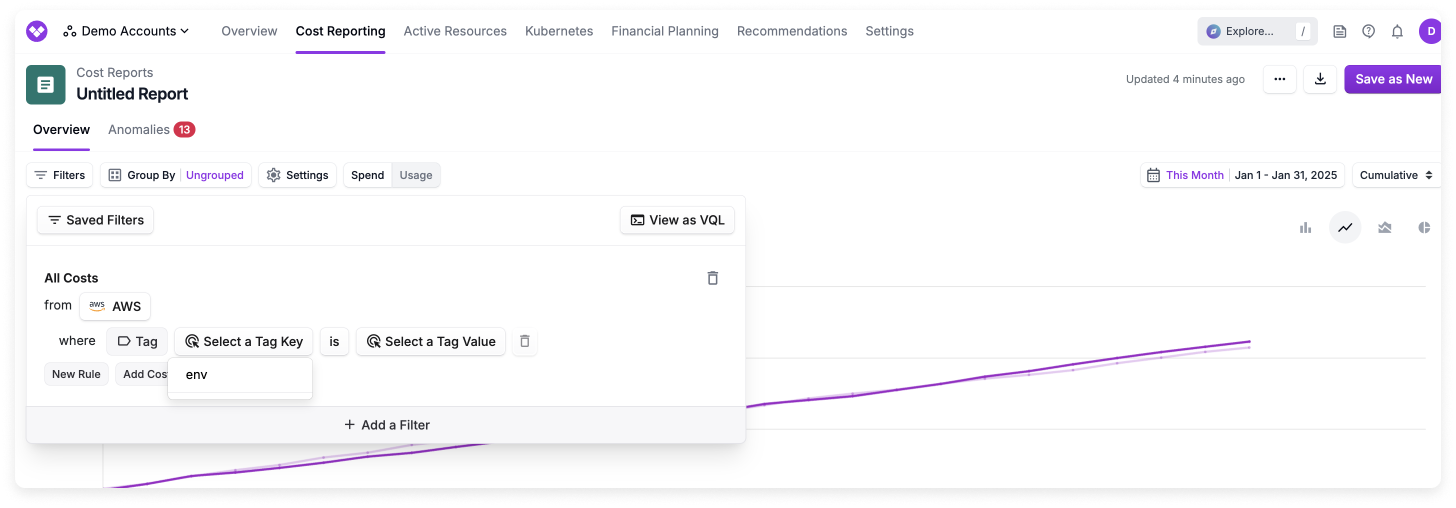
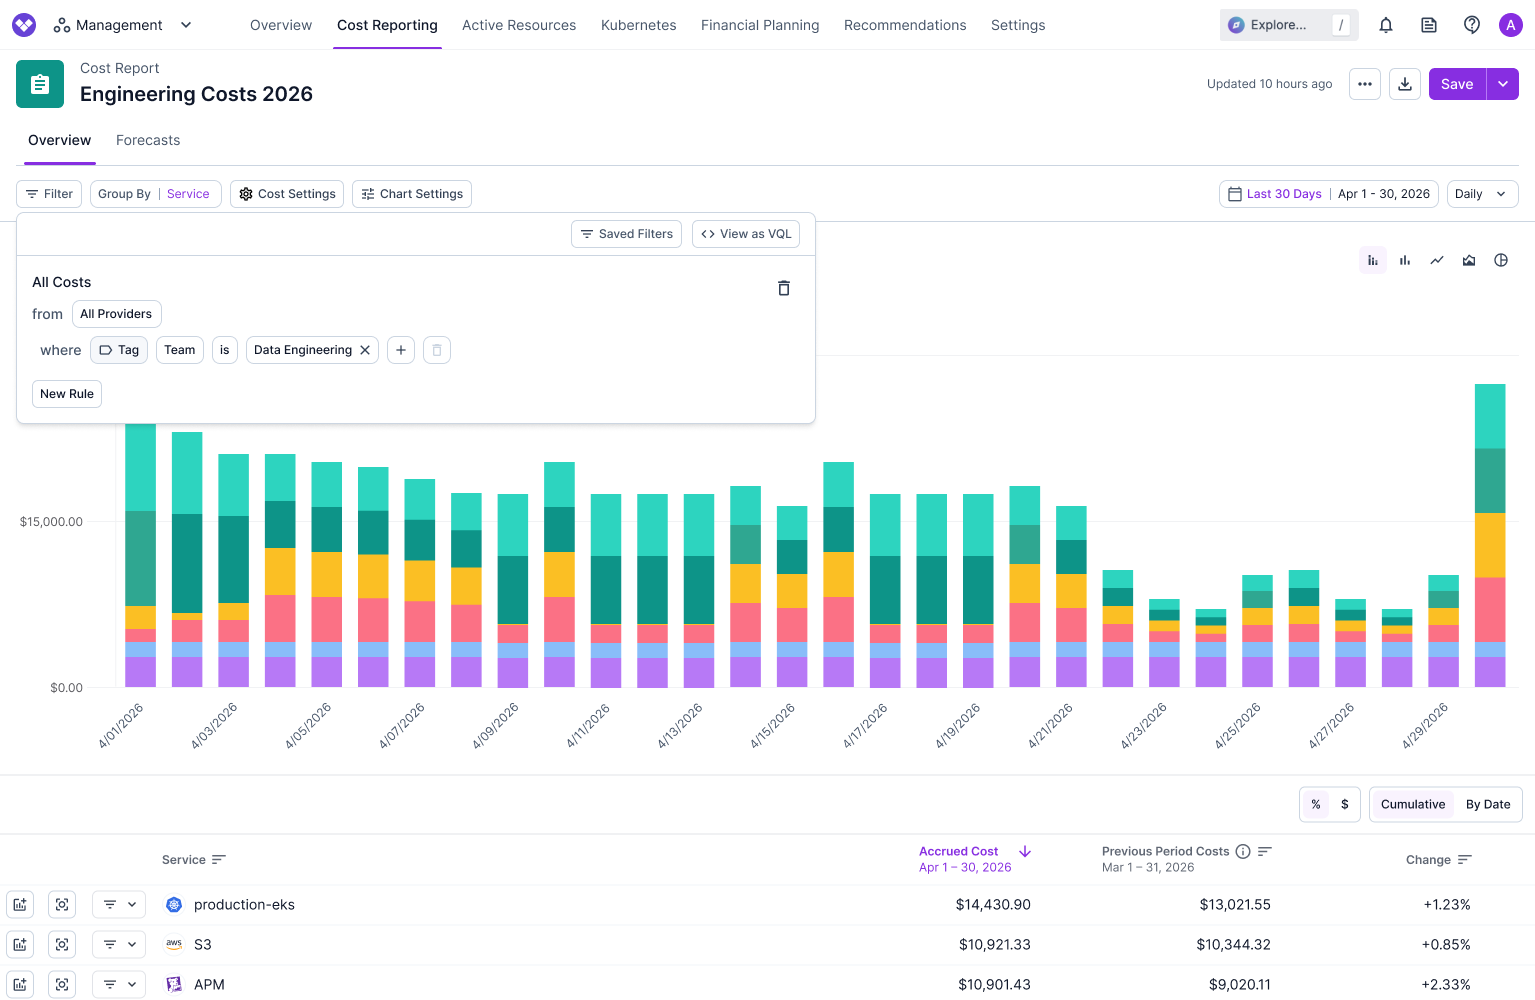
From the Tags page, you can view a Cost Report that is filtered and grouped based on a selected tag. You can do this for both provider and virtual tags. This can help you to view any current or past costs associated with the tag. In the following visual example:- The user searches for the
environmentvirtual tag and selects to view a Cost Report for that tag. - The Cost Report is displayed. The report is filtered by the tag’s associated providers and grouped by that tag’s values.
Virtual Tags
View Virtual Tagging Examples
Review examples for Custom Value Tags, allocation tags, nested Virtual Tags, time-bound ownership changes, untaggable AWS resources, and Tag Key Collapsing.
Virtual Tags vs. Saved Filters vs. Cost Allocation Segments
Virtual tags can be considered foundational to the rest of the data within Vantage. They should remain fairly static, and changes should be considered delicate. These changes will flow across all data and apply to all workspaces. The most common tag keys will be items like team, cost center, and environment. Segments can then be used to create different hierarchical views for tagged data. This feature is useful for breaking down the data by different perspectives, such as by cost center or by OPEX/CapEx. Saved filters can then be used in a more ad-hoc fashion to add lenses on top of base data. For instance, you could create a saved filter just for North America that standardizes a set of regions across providers and can be used by teams on their reports or dashboards without having to know the set of filters needed to create the list of regions. When new regions come online, it’s easy to modify the saved filter to include this region.If you want to transition any of your cost allocation segments to virtual tags, contact support@vantage.sh.
Custom Value Tags
With Custom Value Tags, you can create new cross-provider Virtual Tags to strengthen your tagging strategy. For example, you may have a series of resource tags, by product, across each of your providers. You can create custom tags in Vantage to combine those costs into one unique product tag for all resources in that product group. See the Custom Values Examples for details.Cost Allocation Tags
Vantage supports three types of cost allocation for Virtual Tags, allowing you to distribute costs across teams, applications, or internal financial models:- Use Business-Metric Allocation when you want costs proportionally tied to an external driver (e.g., seats, requests, revenue).
- Use Cost-Based Allocation when allocating proportionally based on another set of costs.
- Use Percent-Based Allocation when you want full manual control or have negotiated/internal ratios that don’t rely on metrics or proportional drivers.
Cost-Based Allocation Tags
With cost-based allocation tags, you can create a dynamically allocated cost structure. Select a set of input costs (e.g., all AWS costs), an existing cost tag to use for allocation (e.g., a team tag), and an output cost (e.g., a static cost, like AWS Support) that you want to be allocated the same way as your input cost. See the Cost-Based Allocation Example for details.Business Metrics-Based Allocation Tags
With business metrics-based allocation tags, you select an existing business metric (e.g., CPU use per product) and indicate your output cost (e.g., all GCP Compute costs) so that the allocation of the output cost mimics the percentage allocation of the existing business metric. See the Business Metrics-Based Allocation Example for details.Percent-Based Allocation Tags
With percent-based allocation tags, you can allocate costs using fixed percentages directly within a Virtual Tag. This gives you full control over how costs are distributed across teams, applications, or internal financial models, without needing external metrics or proportional usage data. Percent-based allocation is ideal for:- Predefined internal chargeback models with negotiated splits
- Manual cost-splitting requirements
- Costs with fixed allocation agreements (e.g., AWS Shield, Marketplace purchases)
The total allocation across all tag values must equal exactly 100%. You cannot allocate more or less than 100% of the filtered costs.
Virtual Tag Allocation Rules
When configuring virtual tag values with allocation types, keep in mind the following rules and restrictions:Can one Virtual Tag mix allocation types?
Can one Virtual Tag mix allocation types?
You can mix different allocation types within the same Virtual Tag Key. Tag configuration rules will be evaluated sequentially, similar to standard Virtual Tag logic.For example, you could create a
Team virtual tag that includes the following separate sets of values:- Custom Value allocations for costs directly tagged with team names in your cloud provider
- Cost-Based allocations for shared infrastructure costs (e.g., allocating AWS Support fees proportionally based on team usage)
- Percent-Based allocations for fixed cost splits (e.g., allocating Marketplace purchases with pre-negotiated percentages: 60% to Infrastructure, 30% to Mobile, 10% to Data)
Small Allocation Grouping
When using cost allocation tags (Business Metrics-Based, Cost-Based, or Percent-Based), Vantage automatically groups allocations that are individually less than 0.01% of the total allocation together under a single label: other allocations (≤ 0.01%/each). This grouping helps simplify Cost Reports by consolidating many small allocations into a single category, making it easier to focus on the larger allocations while still accounting for all costs. The grouped allocations appear with this label in:- Filters: When filtering by tag values, small allocations appear as “other allocations (≤ 0.01%/each)” instead of individual tag values
- Groupings: When grouping by tags in Cost Reports, small allocations are aggregated under this label
- Reports: The label appears wherever tag values are displayed, replacing what would normally show as individual tag values like “Cost Center A” or “Team B”
Virtual Tag Time Frames
By default, a Virtual Tag rule applies to all matching costs regardless of when they were incurred. With time frames, you can optionally set a start date and end date on any Virtual Tag value to control the time period during which that rule applies. This is useful when cost ownership or allocation changes over time, such as during organizational restructuring, resource handoffs between teams, or evolving chargeback models. Time frames are available for all Virtual Tag value types: Custom Value, Business Metric, Cost-Based, and Percent-Based. How time frames work:- Granularity: Time frames are applied at daily granularity. Start dates are inclusive, and end dates are inclusive of the full day. For example, setting an end date of June 30 means the rule applies through the end of June 30.
- Open-ended ranges: You can leave the start date, end date, or both empty. An empty start date means the rule applies from the beginning of your data. An empty end date means the rule applies indefinitely into the future.
- Multiple time frames: You can define the same tag value name multiple times, each with different time frames and potentially different filter criteria. For example, you can define “Team A” for January–June with one set of filters and “Team A” for July onward with a different set.
- Priority and overlapping time frames: Virtual Tag rules are evaluated in priority order within the Virtual Tag. If a cost matches multiple rules with overlapping time periods, the value from the first matching rule is applied, consistent with the standard Virtual Tag order behavior.
- Nested Virtual Tags: Time frames work with nested Virtual Tags. Nested Virtual Tags respect the time frames of the Virtual Tags they reference. Note that tag resolution occurs sequentially, so upstream time frame changes may affect downstream results.
Virtual Tags Limit
You can create up to 50 virtual tag configurations, with each tag supporting up to 100 configuration values. A warning is displayed when you approach the virtual tag limit to help you manage your virtual tag usage before reaching the limit. There is no limit to the number of time frame configurations for a specific tag value, but each time frame configuration applies to the value limit for a Virtual Tag.Create Virtual Tags
This feature requires Organization Owner permissions in Vantage. See the Role-Based Access Control documentation for details. Virtual tags apply to all workspaces.
1
From the top navigation, click Settings.
2
From the side navigation, under General Settings, click Tags.
3
On the All Tags tab, all your tags—both provider and virtual—are displayed. Click the Virtual Tags tab. All existing virtual tags are displayed. You can edit any existing tags from this tab. To add a new virtual tag, click Create a Virtual Tag.
4
Enter a title for the Tag Key.
5
For Billing Period Backfill, select a billing period (e.g., Apr 2024) for which the tag should be backfilled.
6
Enable the Can Override toggle if you want the virtual tag to override an existing service cost value. For example, if you create a virtual tag that conflicts with an existing provider tag, this option will override the existing provider tag key in Vantage reports.
7
In the Values section, click +Add. Select whether you want to create a Custom Value, Business Metric, Cost-Based, or Percent-Based value. Click through the following tabs for instructions on each value type.
For important considerations about filter restrictions, using virtual tags in filters, and mixing allocation types, see the Virtual Tag Allocation Rules section above.
- Add Custom Value
- Add Business Metric Value
- Add Cost-Based Value
- Add Percent-Based Value
1
Click Assign Custom Value.
2
Enter a Tag Value title. Titles can contain only letters, numbers, and the following characters:
_ - & + , . : / \ @. You cannot use saved filters to define a virtual tag value’s filters.3
Specify the tag value’s filter criteria (i.e., Output Cost Filters). These filters function just like filters on Cost Reports and cost allocation segments. For information on how to create detailed filters, see the Cost Reports documentation. You can also click View as VQL to edit filter criteria as VQL directly.You can choose All Providers to apply this rule uniformly across every connected provider (for example, a single
Team = Data Engineering rule that matches AWS, Azure, GCP, and other providers in one configuration). Before doing so, review Best Practices for Filtering Across All Providers for guidance on performance and tag processing time.8
Optional: Set a time frame for a tag value
Click the Set a Time Frame toggle. When enabled, you can enter a Start Date and End Date to define when this tag rule should apply. Both fields are optional:
- Leave the Start Date empty for the rule to apply from the beginning of your data.
- Leave the End Date empty for the rule to apply indefinitely into the future.
- Set both dates to restrict the rule to a specific time period.
9
At the top, click Save.
Nested Virtual Tags
With nested virtual tags, you can use virtual tags as part of the filter criteria for other virtual tag values. The most common use case is nesting Custom Value Virtual Tags so you can align cloud provider data with internal taxonomies for effective grouping and querying. Allocation-on-allocation uses the same chaining concept for allocated tags, but only when the referenced allocated tags belong to the same provider-specific allocation chain. To reference an existing virtual tag in another virtual tag:1
Create a new Custom Value, Business Metric, Cost-Based, or Percent-Based value.
2
Enter a name.
3
For the Output Costs Filter: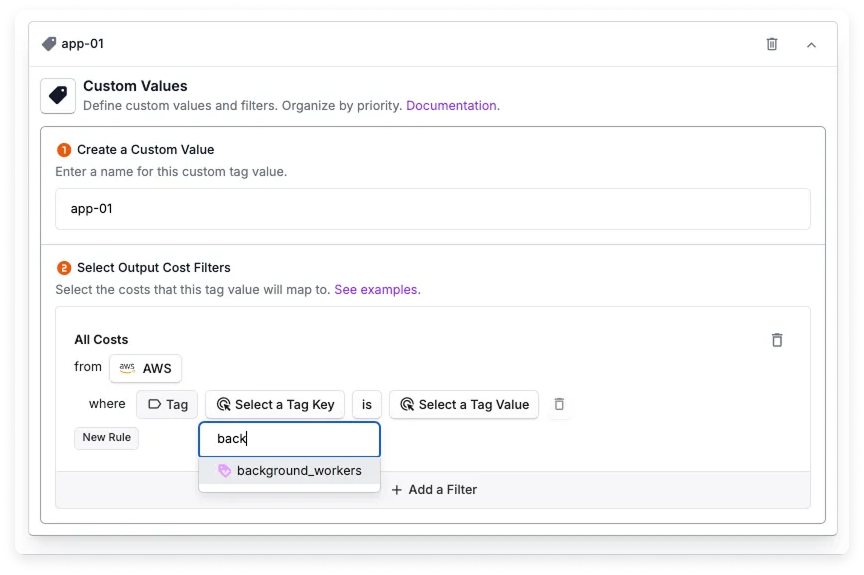
- Select a provider.
- Select Tag, then select an existing virtual tag key. Look for the purple tag icon with the Vantage logo to identify existing virtual tags.
Nested Virtual Tag Considerations
- Do not create a nested virtual tag that references itself (i.e., a cyclical reference); this will result in an error.
- If you update the filters of a virtual tag that is referenced by another virtual tag, costs are reprocessed based on the updated hierarchy.
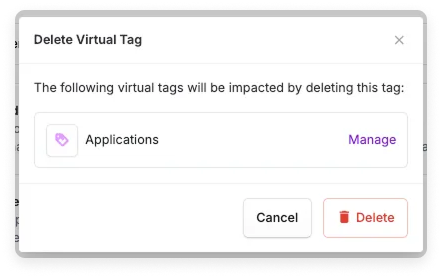
- If you delete or rename a virtual tag that is referenced by another virtual tag, you will see a warning. If you proceed, Vantage reprocesses costs with the new configuration.
- If a nested relationship includes cost allocation, every referenced allocated tag in that relationship must stay within the same provider-specific allocation chain.
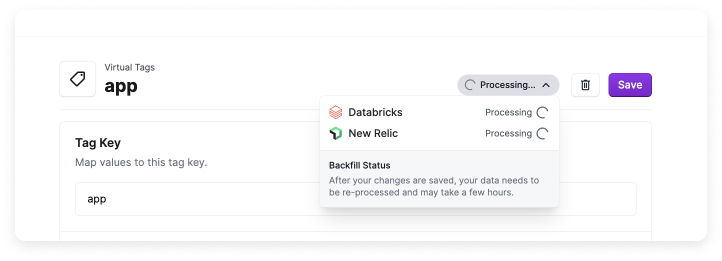
- Changing the Billing Period Backfill on a virtual tag does not automatically update the backfill period on any tags it references. For example, if
Tag AreferencesTag Band you extendTag A’s backfill to an earlier period,Tag Bkeeps its original backfill period. To align data across nested tags, update the backfill period on each tag individually. If any of the tags use cost allocation, update the referenced tags first and wait for processing to complete before updating the parent tag. - You can create up to 49 nested virtual tags, since an organization is limited to 50 distinct virtual tag keys. Because nested virtual tags are processed sequentially, increasing the number of nested values will slow down the tagging process.
Virtual Tag Order
Tag values are arranged in priority order on the Virtual Tags screen. You can move tag values up and down in the UI to reorder them, as demonstrated in the following visual example.
Best Practices for Filtering Across All Providers
As you connect more providers and add more virtual tags, the way you scope each tag affects how long Vantage takes to process tag changes and how quickly reports load. The following practices help keep virtual tags fast and predictable at scale.Scope each tag to the providers it actually needs to evaluate
Scope each tag to the providers it actually needs to evaluate
When you select All Providers for a virtual tag, Vantage evaluates that tag against every connected provider’s billing data. If you know a tag’s rules will only ever match data on one or two providers, scope the filter to those providers instead. For example, a tag that maps AWS account IDs to teams should keep its filters scoped to AWS rather than running across every provider.When you connect a new provider, Vantage automatically includes it in any virtual tag scoped to All Providers. Periodically review your providerless tags and tighten the scope on any rule that doesn’t make sense for the new provider’s data.
Prefer exact-match operators over contains, starts with, and flexible match
Prefer exact-match operators over contains, starts with, and flexible match
Filters that use
is and is one of (equality) evaluate faster than filters that use contains, starts with, ends with, or flexible match. Equality and IN operators compare against indexed values; partial-match operators have to inspect each value to check whether it matches the pattern, which costs more time at scale.Use partial-match operators only when you need to handle inconsistent values, for example, when team names are spelled teamA, team-a, and Team A and you want a single flexible match rule to cover them. If you can normalize the underlying values, for example, by using Tag Key Collapsing or by enforcing a tagging standard upstream, prefer that over a partial-match filter.Use a per-provider OR when you only need two or three providers
Use a per-provider OR when you only need two or three providers
If a tag’s logic should apply to a known set of providers (e.g., only AWS and Azure), create one filter rule per provider rather than going across all providers. Each provider-scoped rule only queries that provider’s data, while a single All Providers rule queries every connected provider regardless of whether matching costs are likely.
Order tag values so high-volume rules match first
Order tag values so high-volume rules match first
Within a virtual tag key, the first value whose filter matches a given cost is the value applied (see Virtual Tag Order). Place the rules that match the most cost rows higher in the list so the majority of your data matches early instead of falling through every rule. This matters more when rules are providerless: every rule below a non-match still has to be evaluated against every provider’s data.
Filter and Group by Virtual Tags
You can filter by virtual tags in Cost Reports, cost allocation segments, and when creating saved filters. Virtual tags are visible along with your existing provider tags. Use the Tag (Label in GCP) filter and grouping option.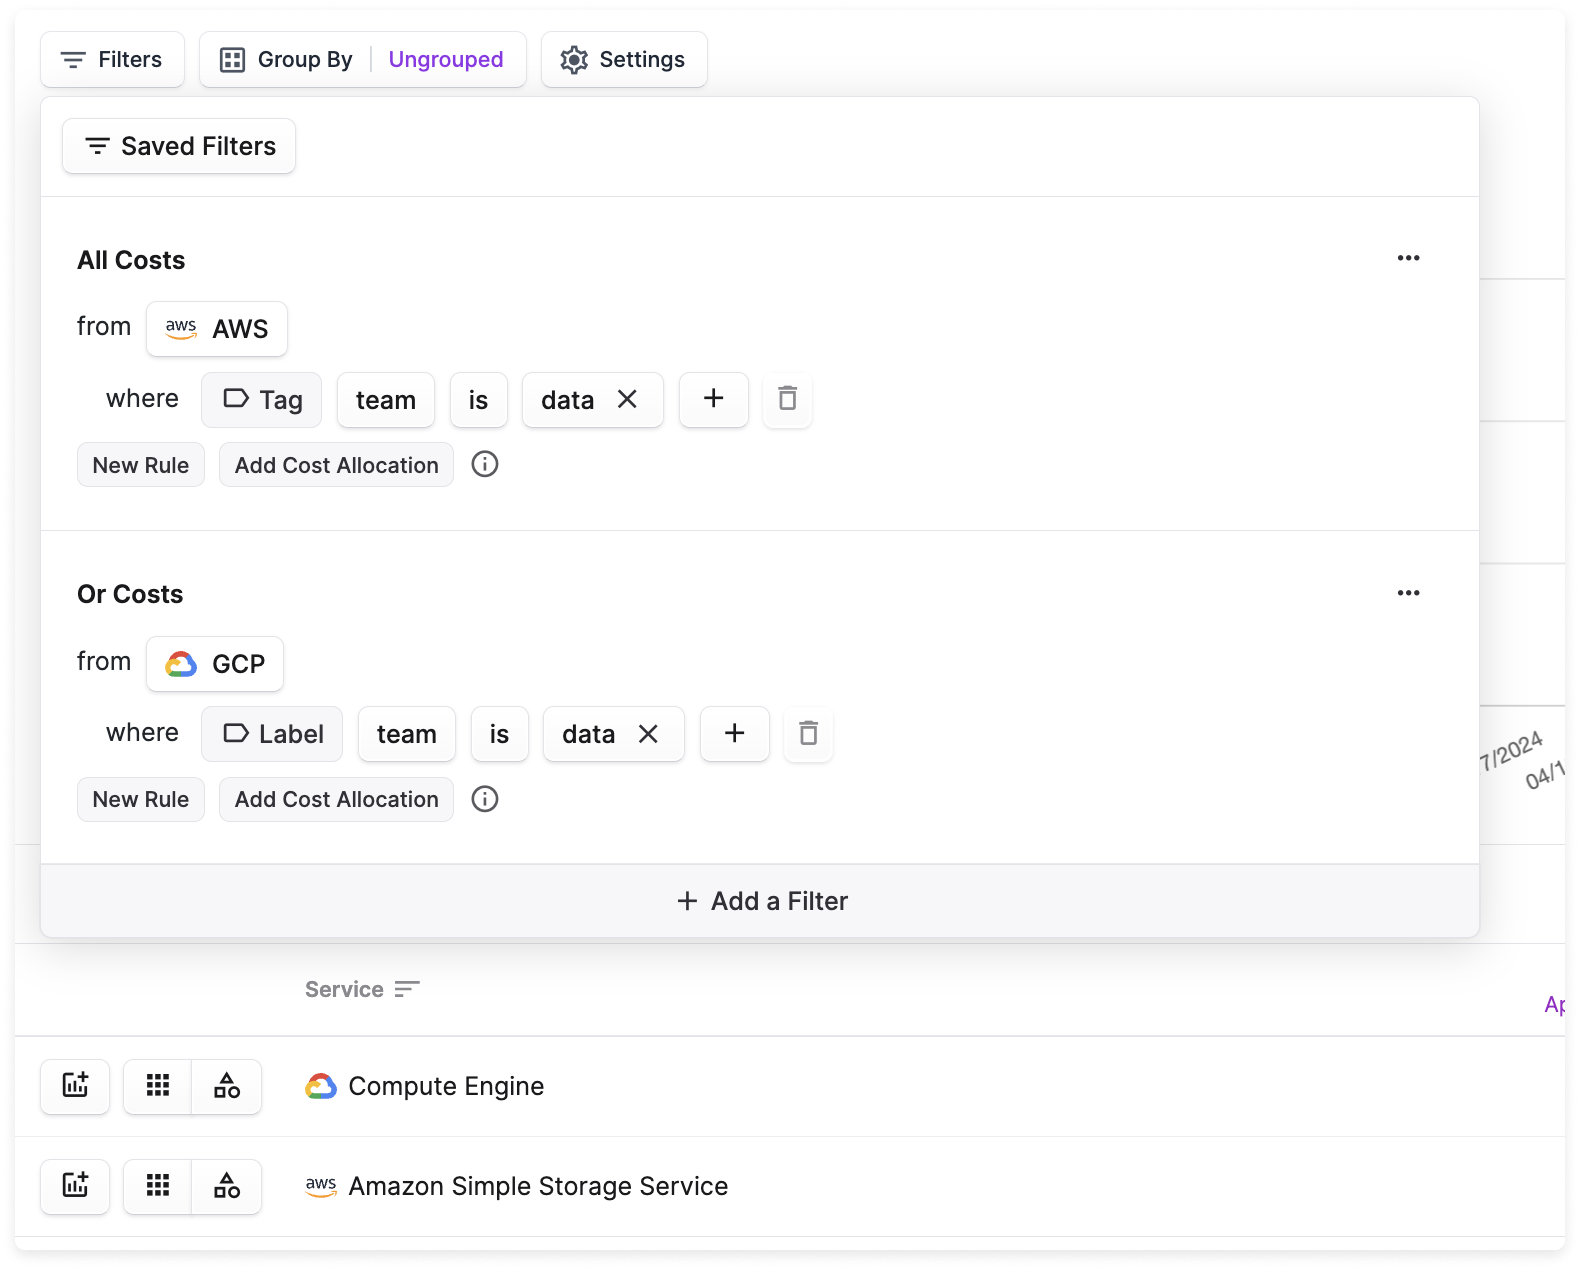
Delete a Virtual Tag
To delete a virtual tag, navigate to the Tags page. Select the Virtual Tags tab and open an existing virtual tag. Click the trashcan icon at the top of the tag page. Your data will be re-tagged, excluding the deleted virtual tag, going back to the deleted tag’s backfill bill period. Newly ingested data will no longer be tagged with the deleted tag. For Percent-Based Allocation tags, when you delete the tag, the allocation will be removed, and the costs will be reprocessed to reflect their unallocated state for that Virtual Tag key. Once reprocessed, your allocation will be removed from your cost data in Cost Reports.Tag Key Collapsing
Tag key collapsing allows you to consolidate semantically redundant tag keys into a single standardized virtual tag. When you create a virtual tag, you can collapse both provider tags (tags from your cloud providers like AWS, Azure, or GCP) and virtual tags (existing virtual tags you’ve created in Vantage) into that virtual tag.How It Works
Vantage automatically merges values from collapsed tag keys into your virtual tag. For example, if some teams useenv while others use Environment, both can be collapsed into a single virtual tag key like environment. Tag Key Collapsing works across all connected providers in Vantage, and there is no hard limit on the number of tag keys you can collapse into a single standardized key.
Evaluation order
Collapsed keys are evaluated before virtual tag value configurations (i.e., any configurations added to the Values tab). If a resource matches a collapsed key, that value is used instead of value configurations. When you remove a collapsed tag key mapping, the collapsed values will be removed up until your specified backfill period for the virtual tag.
Each collapsed key can be expanded to configure two optional settings:
- Filter: Restrict which costs are eligible for that collapsed key (for example, a specific provider or account). If a filter is set, only costs that match both the source tag key and the filter can contribute a value. When filters on different collapsed keys overlap, the value from the first matching key (highest in the list) is used.
- Value prefix: Prepend a fixed string to every value taken from that collapsed key. This is useful when you need to distinguish which source key a value came from after collapsing. For example, with a prefix of
aws:, a value ofproductionbecomesaws:productionin the virtual tag.
env:prod and environment:production, and environment is ranked higher, the resource will be tagged with production.
Priority works similarly to Virtual Tag Order for tag values—the first matching key in your list takes precedence.
Original tag keys remain in your data; you can choose to hide them from reports using the Hide Tags feature.
Collapse Tag Keys
To collapse tag keys, you first need to create a virtual tag or edit an existing one.
1
Navigate to Settings > Tags and select the Virtual Tags tab. Click Create a Virtual Tag or edit an existing virtual tag.
2
For a new virtual tag, enter a Tag Key name. This will be the standardized key that all collapsed tag keys will map to. Configure Billing Period Backfill and Can Override settings as needed.
3
In the tag configuration section, you will see two tabs: Values and Collapsed Keys. Select the Collapsed Keys tab.
4
In the search field, search for and select the tag keys you want to collapse into this virtual tag. You can select multiple tag keys, including both provider tags and existing virtual tags. Once added, each collapsed key appears in a list.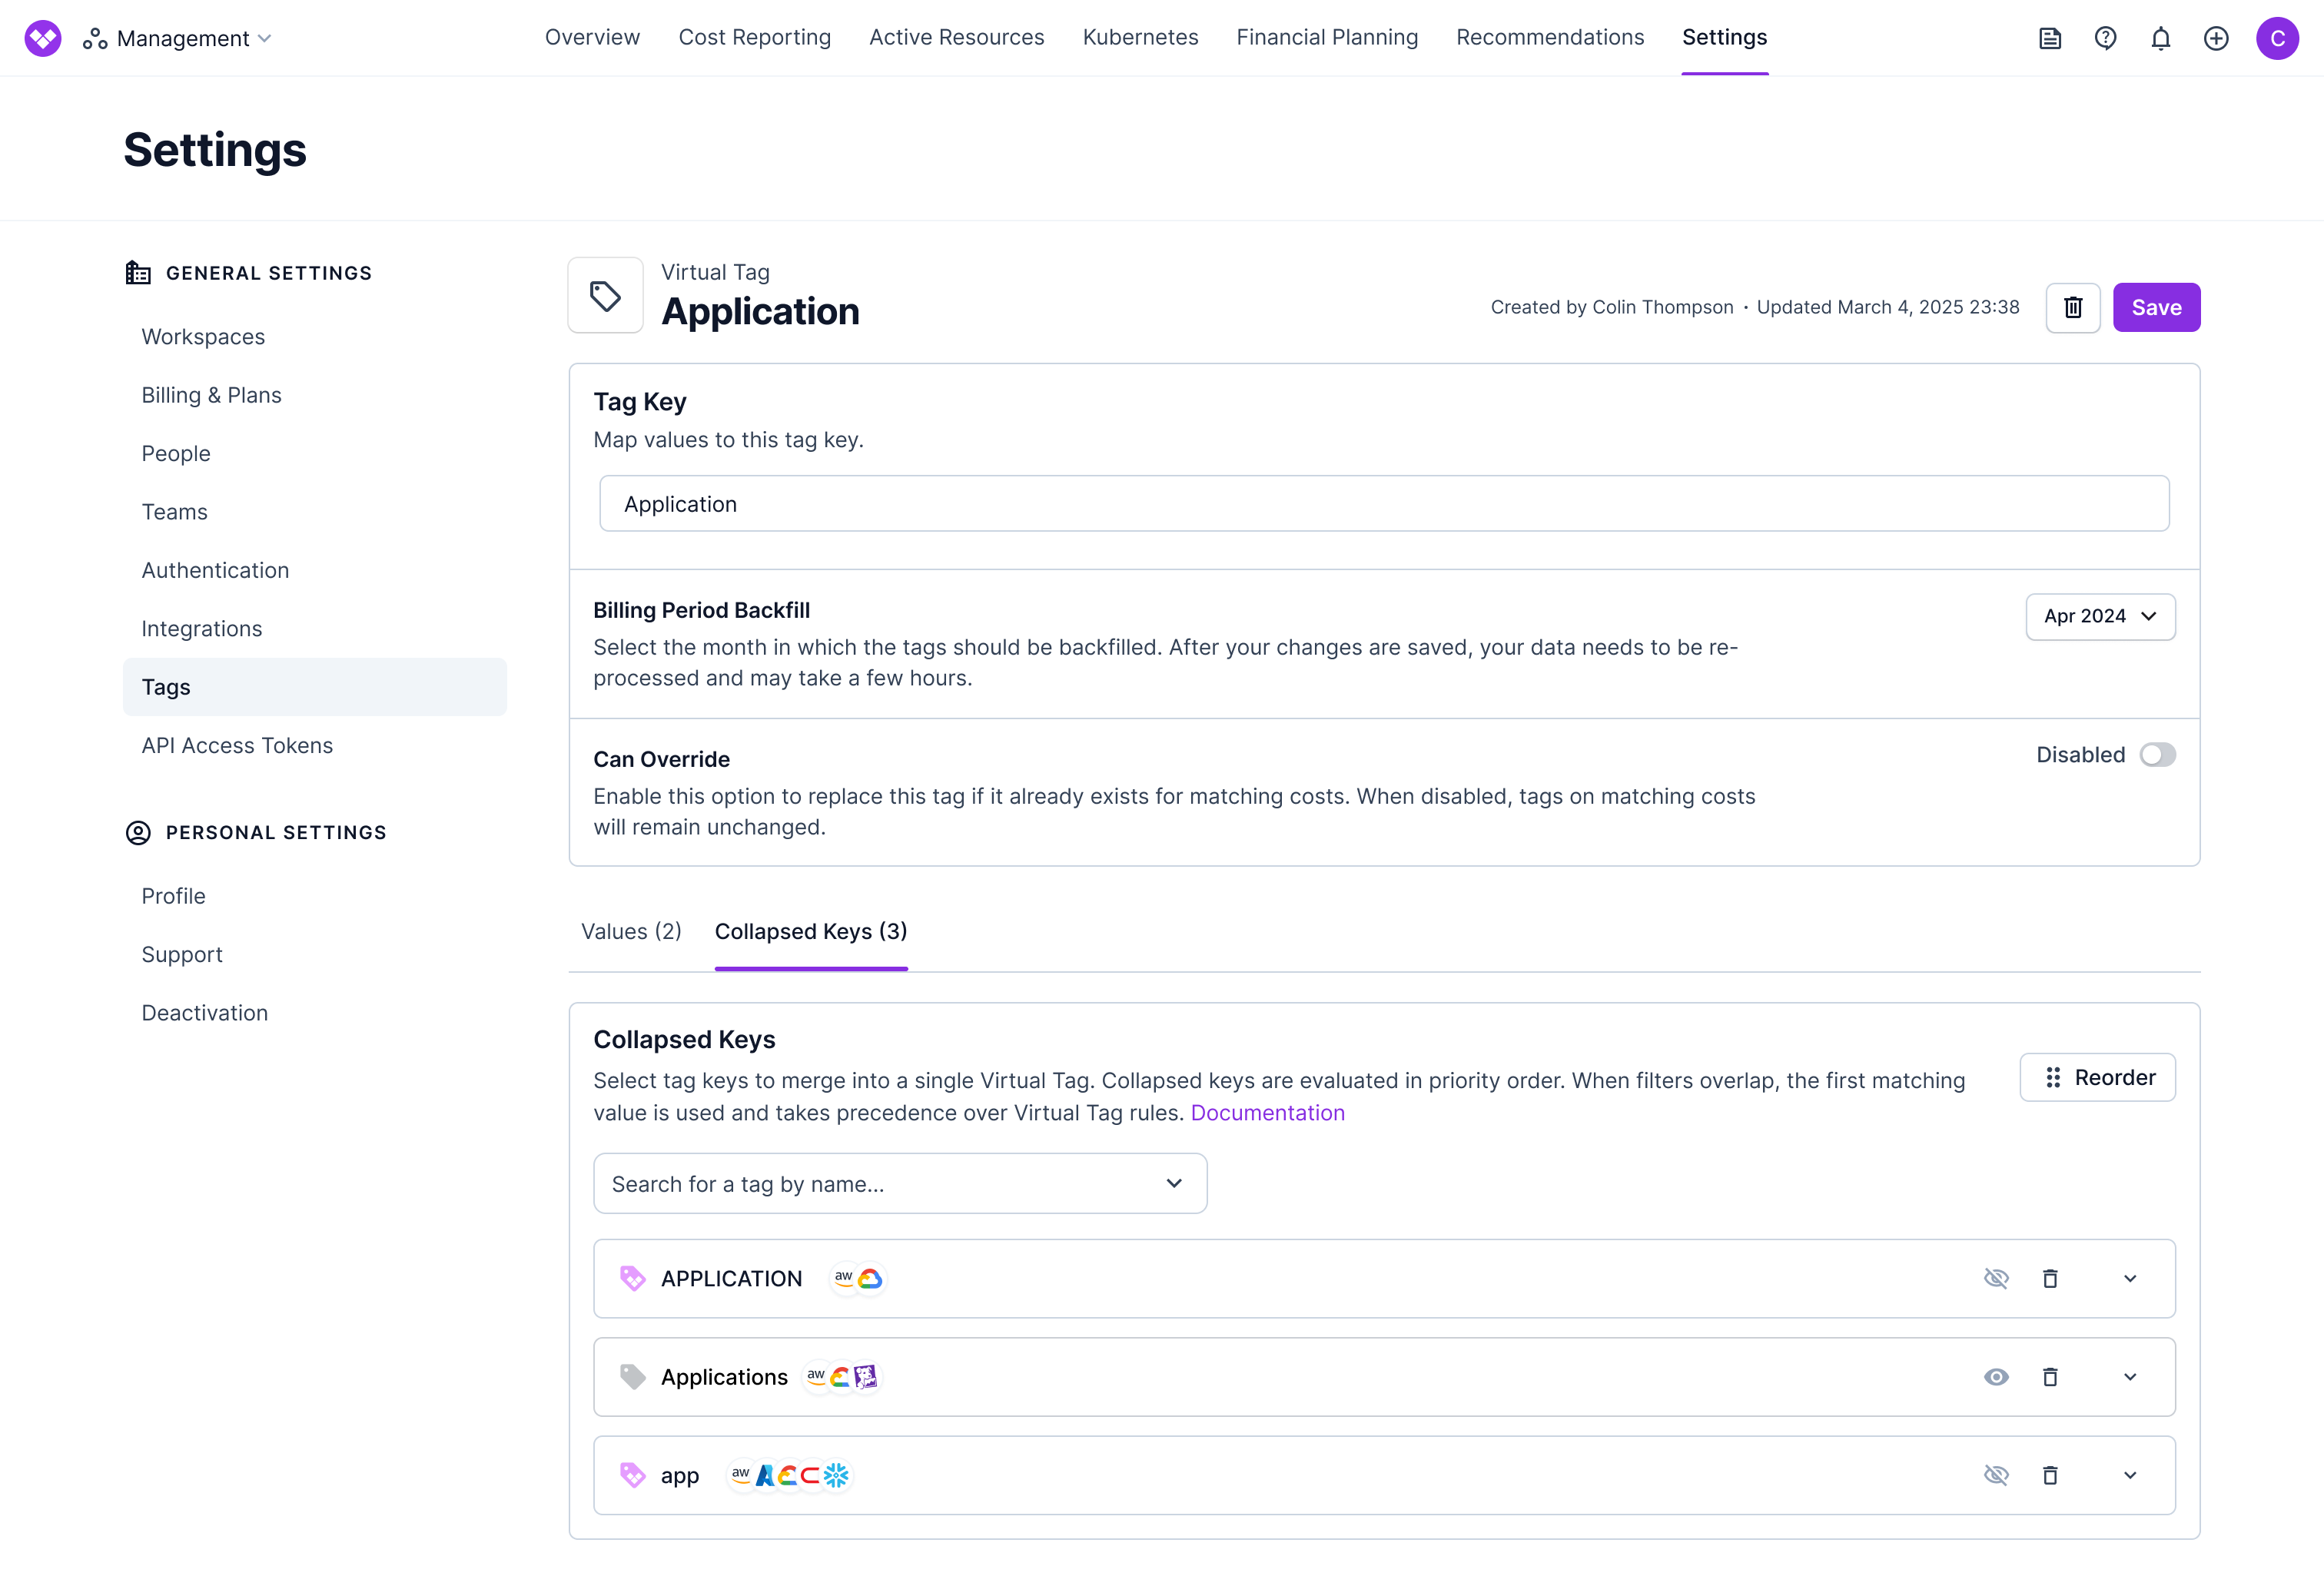
5
Reorder collapsed keys as needed by clicking the Reorder button in the top right and dragging the keys to your desired priority order.Keys higher in the list take precedence over keys lower in the list.
6
Optional: Configure filters and value prefixes per collapsed key
Expand a collapsed key row to configure optional settings:
- Add a Filter (optional): Use the same filter builder as Cost Reports to limit which costs are eligible for collapsing from that source tag key. For example, you can scope to one or more Provider values, accounts, services, or other dimensions. If you do not add a filter, Vantage merges values from that tag key everywhere it appears in your account (across providers that have that key in your data).
-
Add a Value Prefix (optional): Turn on the prefix toggle and enter a string to prepend to every collapsed value from that key. The prefix is applied exactly as entered, and no separator is added automatically. For example, with the prefix
team:, the valueengineeringbecomesteam:engineering. When a prefix is active, a badge displaying the prefix appears on the collapsed key row so you can see it at a glance without expanding the row. Turning the toggle off clears the prefix. Prefixes can contain letters, numbers, spaces, and the following characters:_ - @ & + , . : /.
team from AWS and Team from Azure into a single virtual tag by adding a Provider filter on each collapsed key, while leaving other providers’ team tags out of scope.When no per-key filter is set, any new provider integration that starts reporting the same tag key can be included automatically once that key appears in your data. When you scope a collapsed key with a filter (for example Provider = AWS only), only costs within that filter are eligible—other providers or accounts are not included unless you add them to the filter.
7
Optional: Add value configurations
If you want to add additional value configurations, click the Values tab.Remember that collapsed keys are evaluated first, so any resources already matched by collapsed keys will use those values instead of the value configurations.
8
Click Save at the top of the page.