This feature is currently available only for AWS, with plans to expand to Azure and GCP in the future.
Requirements
Financial Commitment Reports require an AWS integration with Cost and Usage Reports (CUR) enabled. The reports become available after the first CUR delivery/import has been successfully processed—that is, after at least one CUR file has been delivered to and ingested from the S3 bucket Vantage reads from. If you see “Data is Processing”, Vantage is still waiting for that first successful CUR import. For backfilling past months, see Backfilling AWS CUR for previous reporting periods.Understand Discounted Coverage and Effective Savings Rate
Financial commitment reports in Vantage help you understand your overall discounted coverage and effective savings rate. These metrics are described in detail below.Coverage
Coverage is the percentage of On-Demand usage offset by financial commitments, such as Reserved Instances and Savings Plans. Coverage can be calculated as: Here, Covered Use refers to the gross On-Demand equivalent of usage covered by commitments (i.e., what that usage would have cost at On-Demand rates without discounts). On-Demand Use reflects actual On-Demand spend.Spot usage is excluded from this calculation as it is not eligible for committed usage discounts.
- The two Reserved Instances cover $120 in gross On-Demand equivalent usage.
- The three On-Demand instances account for $180 in gross On-Demand usage.
Effective Savings Rate
Effective savings rate measures the impact of purchased financial commitments as well as discounts, refunds, and credits. If you use financial commitments with higher discounts, you’ll improve your effective savings rate. The effective savings rate can be calculated as follows. As an example, an app uses a large-sized Reserved Instance, with a one-year no upfront commitment. It costs $0.20 per hour. The app used the Reserved Instance for 90% of the month (i.e., 657 hours, when using a value of 730 hours for the month).- The Reserved Instance costs a total of $146 for this month ($0.20 x 730 hours).
- The On-Demand equivalent of this instance costs a total of $164.25 for the month ($0.25 per hour x 657 hours).
Create a Financial Commitment Report
1
Navigate to the Financial Commitment Reports screen. All existing reports are displayed. From this screen, you can edit and delete existing reports.
2
To create a new report, click New Report.
3
To filter costs, click the Filters button on the top left of the graph.
- The AWS costs where… tile is displayed. Click + New Rule.
- For Category, select an available filter category.
You can filter by service (e.g., Amazon EC2), account, billing account, commitment type (e.g., On-Demand), commitment ARN, charge type (e.g., Spot Usage), category (e.g., Compute Instance), subcategory (e.g., AP-Requests-Tier1), instance type (e.g., m5.large), region, and tag.
- Two additional dropdown menus are displayed. Select is, is not, contains, or does not contain based on your desired filter criteria, then select one or more corresponding values from the second dropdown menu. For Tag, the Tag Key dropdown is displayed before the operator dropdown.
- Click Save.
Click to view a visual example
Click to view a visual example
4
You can optionally edit your existing rules or add additional filter criteria.
- To edit the rule you just created, select the rule, make your changes, and then click Save.
- If you want to add a rule to filter multiple criteria, such as filter by certain services and another rule to filter by certain regions, click + New Rule. Add the additional criteria and save.
- To add a separate rule set, click + New Filter. This rule set will be displayed as Or AWS costs where… in a new rule section.
- To delete a rule set, click the trashcan icon on the top right of the rule set.
5
Above the rule set(s), click Apply. The graph will update with your existing filter criteria.
6
To save the report, click Save as New. Enter a report name, and click Save. (To edit this name, click the pencil icon in the breadcrumbs above the chart, next to the report’s name.)
Apply Aggregations to Reports
You have the option to further drill down into your costs:-
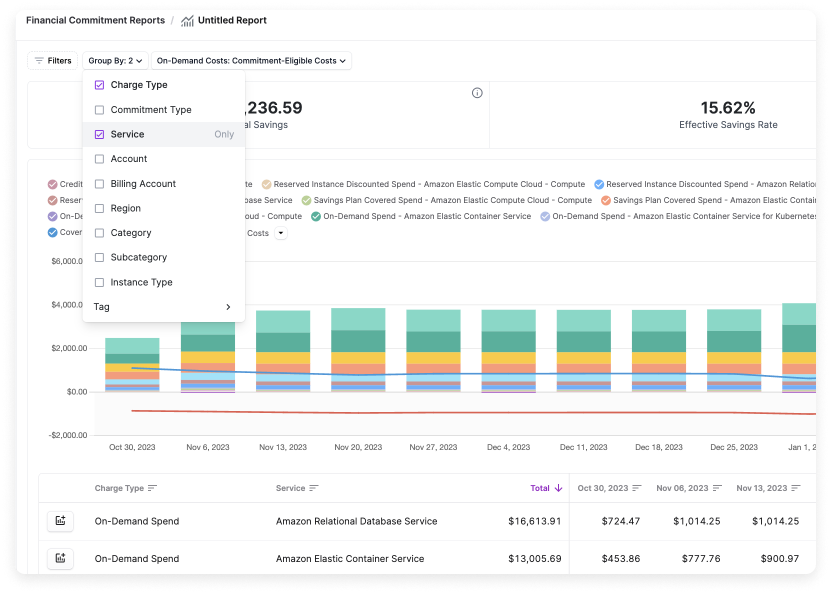
Above the graph, click the Group By dropdown menu. Select one or more grouping options. You can group by charge type, commitment type, commitment ARN, service, account, billing account, region, category, subcategory, instance type, and tag.
Click to view a visual example
- To adjust the date binning, click the data bin menu on the top right of the graph. Select either Daily, Weekly, or Monthly. Hourly granularity is available as an opt-in feature. See the section below for details.
-
To change the date range, click the date menu on the top right of the graph and adjust the date range.
You can historically view back as far as your account’s retention period. By default, this period is six months.
Hourly Reporting
To enable this feature, contact support@vantage.sh.
- Navigate to the AWS integration settings page and look at the Cost Aggregation column next to your AWS integration.
- Navigate to the Services Active Resources page.
- Select CUR Report Definitions.
- Select a listed report.
- Under the metadata box on the right, check the Time Unit field.
If you’re viewing costs at an hourly granularity and select a date range longer than 14 days, Vantage will display a warning that your view will switch to daily granularity.
Commitment Eligibility Filter
You can also adjust the report to include only costs that are eligible for Reserved Instances and Savings Plan commitments. Click On-Demand Costs: and select one of the following options:- All Costs: Display all costs that are relevant to financial commitments, excluding marketplace purchases, tax, and free tier usage. All AWS services are included in this view.
- Commitment-Eligible Costs: This option is the default option. Only costs that are eligible for Reserved Instances and Savings Plans are displayed. With this option, you can choose whether to include all your On-Demand AWS costs in the effective savings rate calculation or only those costs eligible for potential coverage by Savings Plans and Reserved Instances. This option includes the following services:
- Amazon EC2
- AWS Lambda
- Amazon SageMaker
- Amazon RDS
- Amazon Aurora
- Amazon DynamoDB
- Amazon ElastiCache
- Amazon DocumentDB
- Amazon Neptune
- Amazon OpenSearch
- Amazon EKS
- Amazon ECS
Review the Report
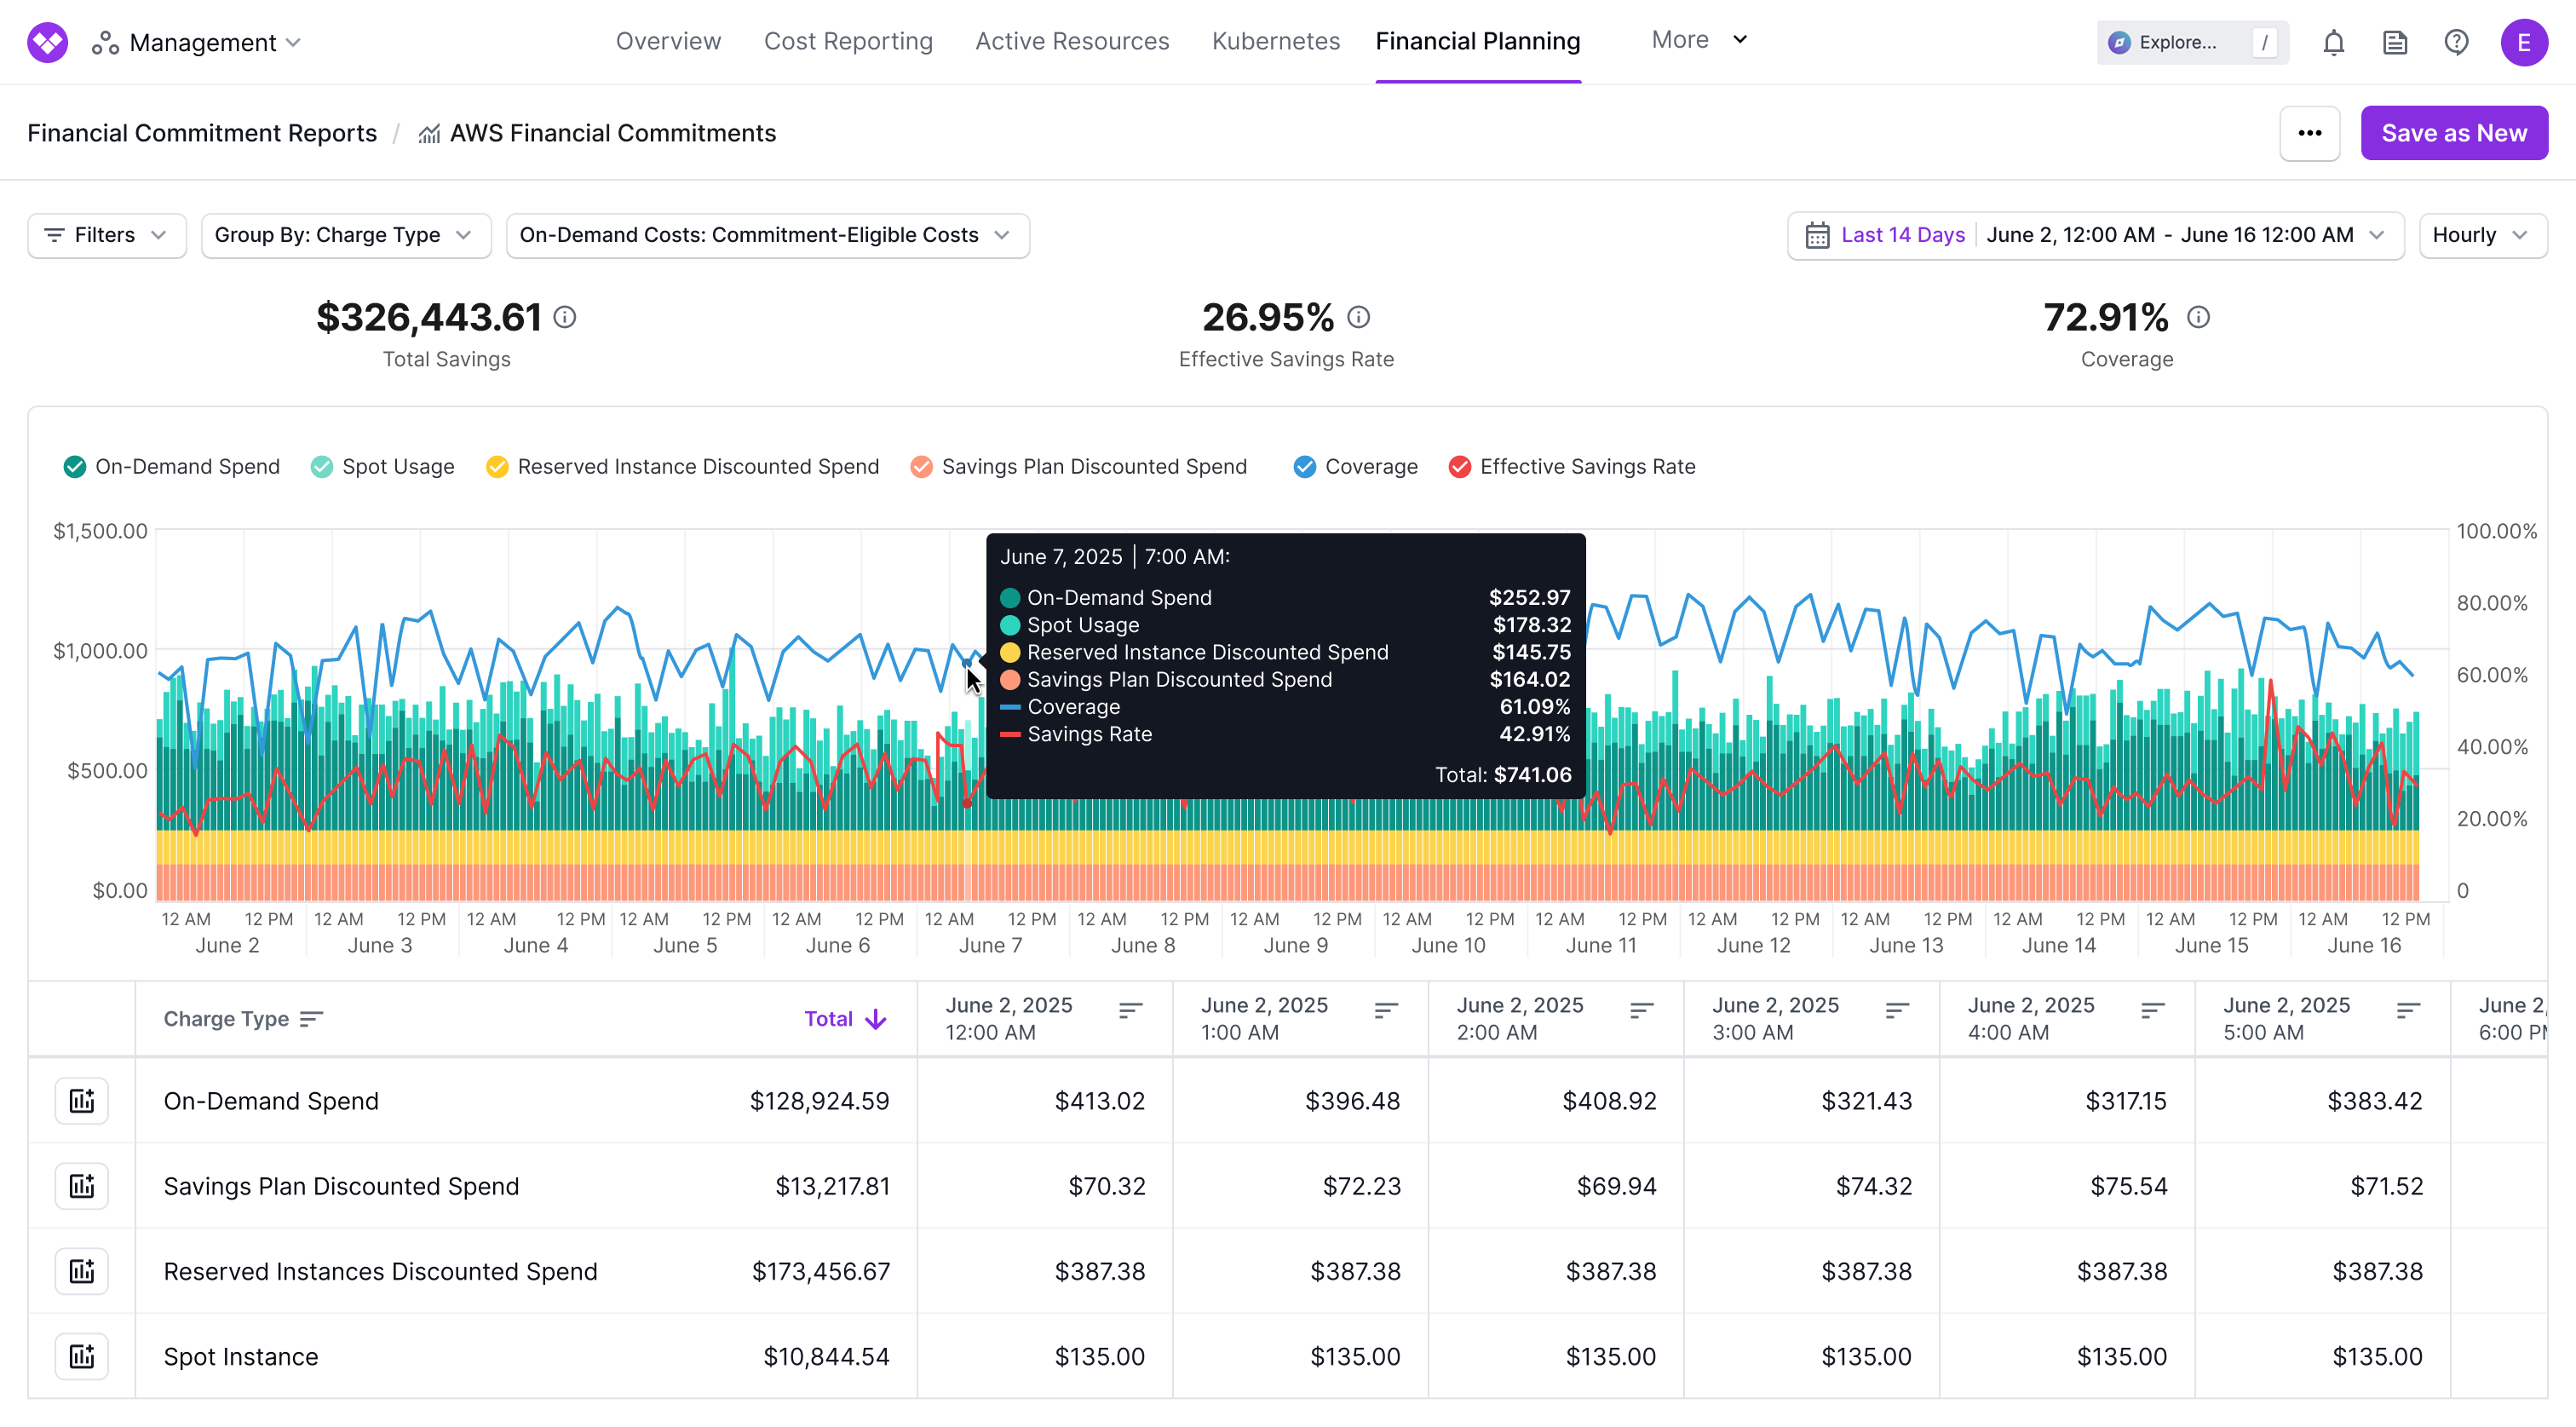
By default, financial commitment reports are grouped by Charge Type (e.g., Savings Plan Discounted Spend, Spot Usage). Groupings are represented by each colored section of the bar chart. Hover over any bar to get a breakdown of costs. The breakdown is also provided in the table below the chart.Costs in the graph are unblended.
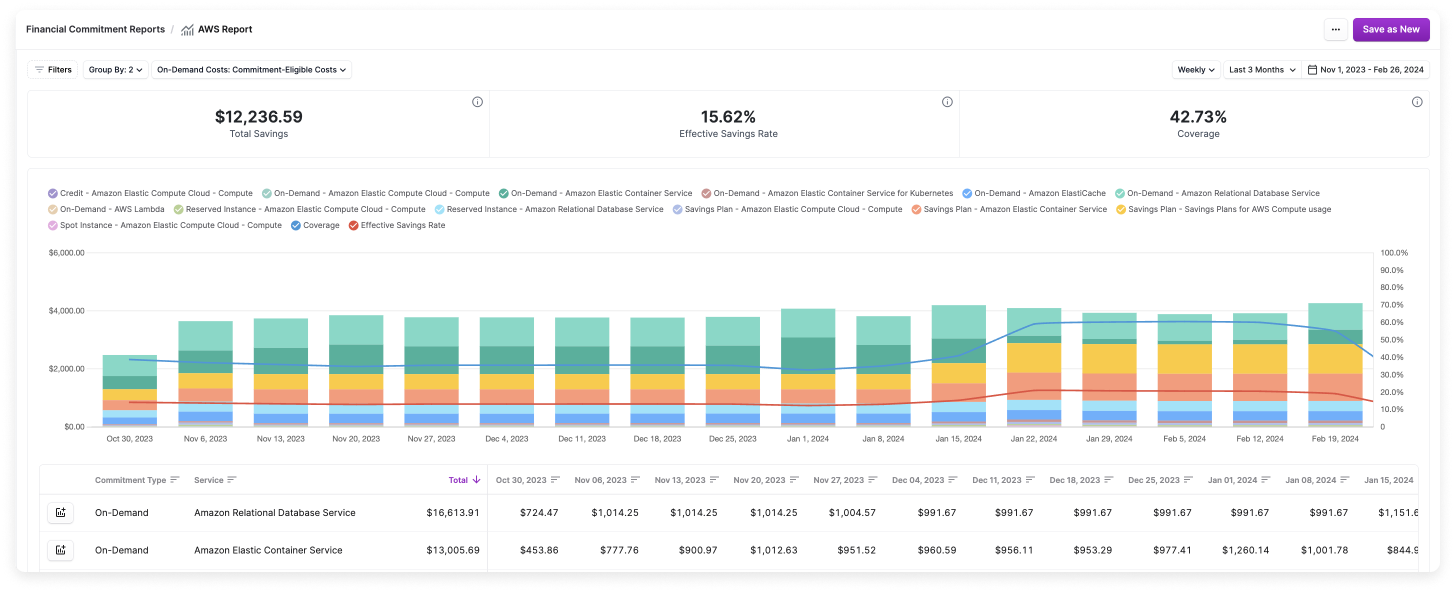
- Total Savings: The total amount saved by using your financial commitments and other discounts.
- Effective Savings Rate: The percentage discount across all usage. (See the section above for a more in-depth explanation of this metric.)
- Coverage: The percentage of total spending that is covered by financial commitments. (See the section above for a more in-depth explanation of this metric.)