Supported Providers
The following providers populate usage data in Vantage. Units are normalized in the console for consistent spelling and capitalization (for example,hrs and Hours both display as Hours).
If a provider is not listed above, the Usage Unit column is empty and Accrued Usage displays 0.00. Vantage plans to add support for additional providers. Contact support@vantage.sh with providers you’d like to see added.
Create Usage-Based Reports
1
Navigate to any Cost Report, or create a new report. By default, the report displays Spend.
2
Apply any desired filters and Group By criteria. Then, open the Chart Settings menu and select Usage for the Y Axis.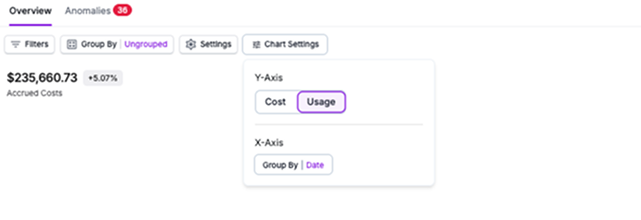
3
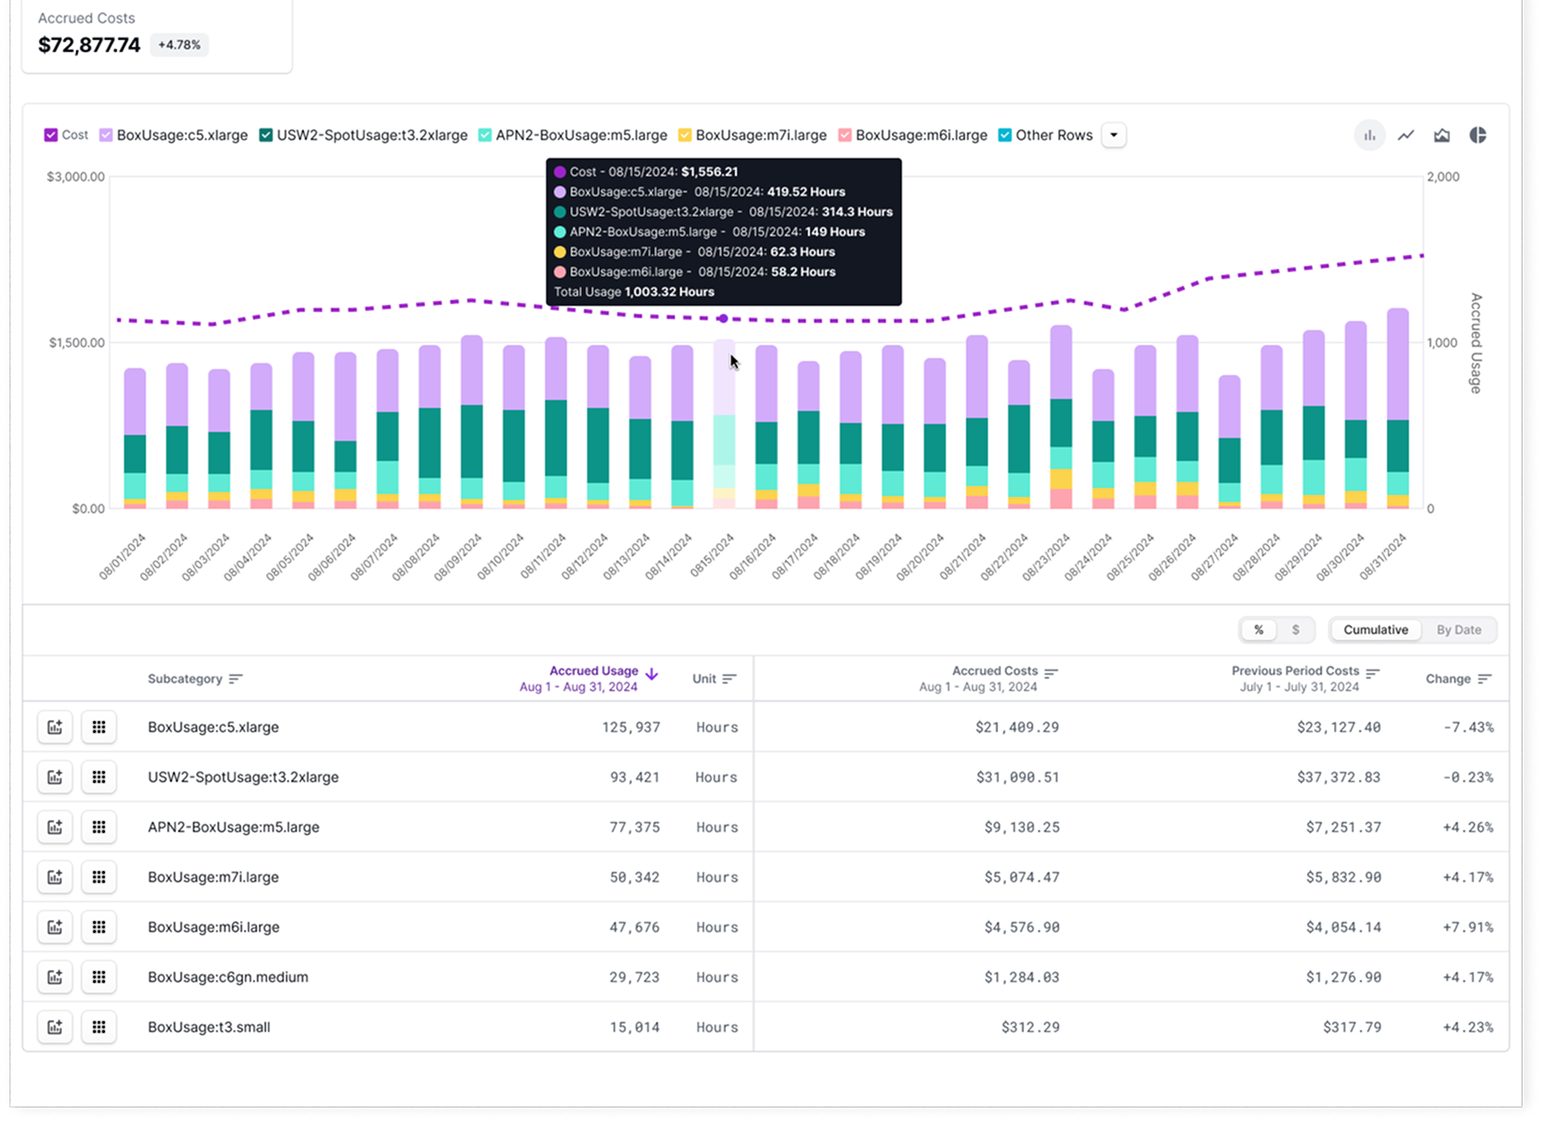
The following elements are displayed on the Usage view:
- The graph and chart display usage over the selected timeframe.
- The total cost is displayed as a trendline on the chart.
- In the table below the graph, the Usage Unit (e.g., GB-Hours or Metrics) and Accrued Usage (a numerical value of calculated usage for that unit) columns are displayed to show accrued usage for each grouping. The Usage Unit column is normalized for consistency across usage type for spelling, abbreviation, and capitalization.
- Accrued Usage, Previous Period Usage, Accrued Cost, Previous Period Cost, and Change between these cost values are also displayed. Click the By Date option above the table to see the usage data split out by date.
4
Save the report.
Usage data refreshes daily in the Vantage console. At this time, you cannot view retroactive usage metrics. Contact support@vantage.sh if you want to view historical usage data.
Export Usage Reports
To export usage reports, follow the steps provided in the Cost Reports documentation. Ensure you are on the Usage view and Usage Unit is selected.View Usage Data for Custom Costs
When you create a Custom Provider, you can add usage data to your CSV upload files. Ensure you complete theConsumedQuantity and ConsumedUnit columns. See the Custom Providers documentation for information on the required schema.
Understand Usage Units
The Usage Units displayed on Usage-Based Reporting include any dimension that a supported provider meters and bills. Vantage standardizes these dimensions for inconsistencies in unit case and spelling across providers. For example, Vantage standardizesHours, hrs, Hrs, and hours to Hours. See the Supported Providers table for the units available per provider.
Use Virtual Tags with Usage-Based Reporting
Virtual Tags work across both cost and usage consumption for supported providers. If you created Virtual Tags based on cost, the associated usage consumption will inherit the same Virtual Tag. You can use Virtual Tags within your filter criteria to apply Virtual Tags based on usage.Usage-Based Reporting on Dashboards
You can add Usage-Based Reports to dashboards. Ensure you are on the Usage toggle, save the report, and then add it to a dashboard. Follow the Dashboards documentation for details on how to add a report to a dashboard.Usage Reports Examples
The following examples provide some common use cases for working with Usage-Based Reporting.Understand EC2 Running Hours
As an Engineering Manager, you want to view your Amazon EC2 usage by instance hours, so that you can get a profile of your compute usage. This is important because it helps you identify patterns in compute resource consumption. This type of report can help you create more efficient resource planning and cost optimization based on your team’s workload needs. You create the following Usage-Based Report in Vantage:- Filter: All costs from AWS where Category Amazon Elastic Compute Cloud - Compute is Compute Instance
- Group By: Subcategory
View S3 Storage by Tier
As a Storage Admin or Engineering Manager, you want to view detailed storage metrics across specific AWS services, such as the total data stored in S3 by tier. With this report, you can better understand the overall profile and efficiency of stored assets and potentially determine whether additional storage policies are required to optimize storage usage and growth. You create the following Usage-Based report to see total data stored in S3 in Vantage:- Filter: All costs from AWS where Category Amazon Simple Storage Service is Storage
- Group By: Subcategory
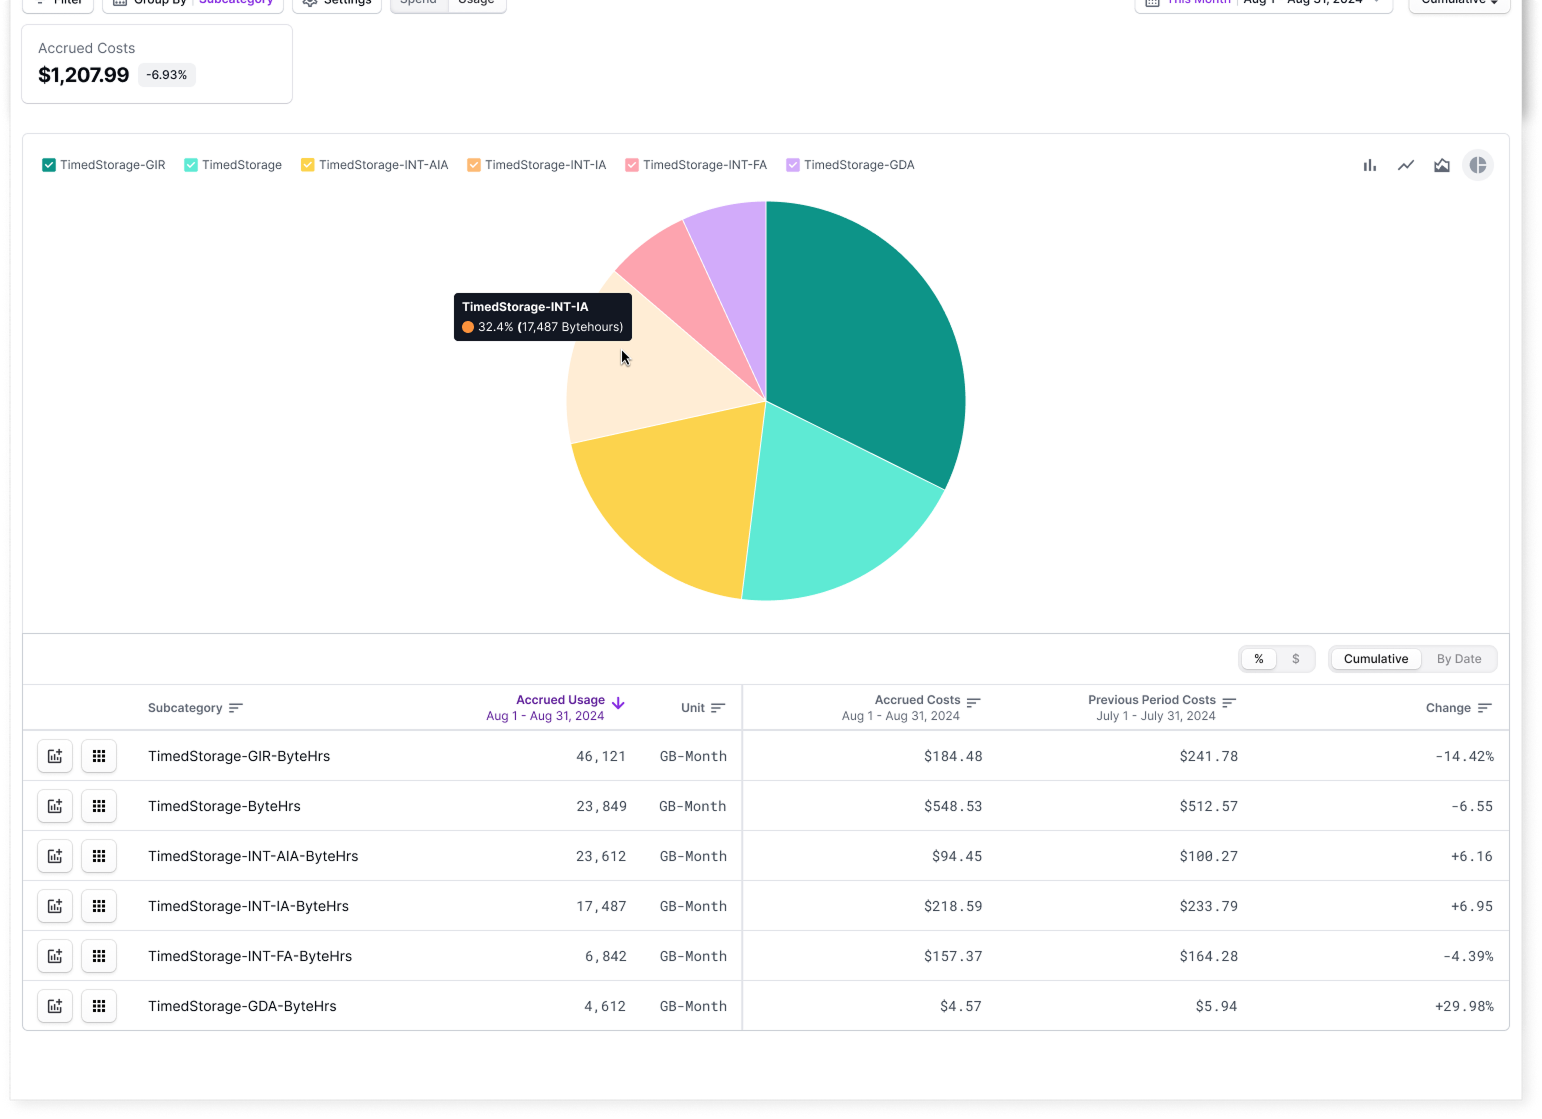
- TimedStorage-INT-AIA-ByteHrs (Infrequent Access Tier)
- TimedStorage-INT-IA-ByteHrs (Intelligent Tiering)
- TimedStorage-ByteHrs (Standard Tier)