Usage is only accessible for parent-level organizations.
Looking to connect Datadog to the Vantage FinOps Agent? See the Datadog MCP documentation. The Datadog MCP Connector reuses this same Datadog OAuth application, and you may be prompted to reconnect/reauthorize to grant any additional scopes required for the agent to read live telemetry (metrics, logs, monitors, events) alongside billing and usage data.
Connect Your Datadog Account
Prerequisites
- You must have a Vantage Organization Owner or Integration Owner role to add or remove this integration. See the Role-Based Access Control documentation for details.
-
When connecting your Datadog account, you must be a Datadog Admin who is able to authorize the following scopes:
billing_read,usage_read,metrics_read,timeseries_query,logs_read_data,logs_read_index_data,logs_read_workspaces,monitors_read,apm_read,dashboards_read,mcp_read,incident_read,events_read, andllm_observability_read. See the Datadog documentation for more information on roles. - Create a free Vantage account, then follow the steps below to integrate Datadog costs.
Create the Connection
1
From the Vantage console, navigate to the Integrations page.
2
Select Datadog and add a connection.
3
You will be brought to the Datadog login screen and guided through the Datadog OAuth flow for adding your Datadog account.
Once connected, Vantage will ingest six months of historical Datadog costs.
Next Steps - Manage Workspace Access
Once the import is complete and the integration status changes to Stable, you can select which workspaces this integration is associated with. See the Workspaces documentation for information.Data Refresh
See the provider data refresh documentation for information on when data for each provider refreshes in Vantage.Update the Datadog Integration
Sometimes an update is required to use new Vantage features related to Datadog. Navigate to the Manage Integration page for your Datadog integration. If you need to update the integration, the Update Required button is displayed in the Status column. Click the button to access the OAuth integration workflow and reconnect your integration.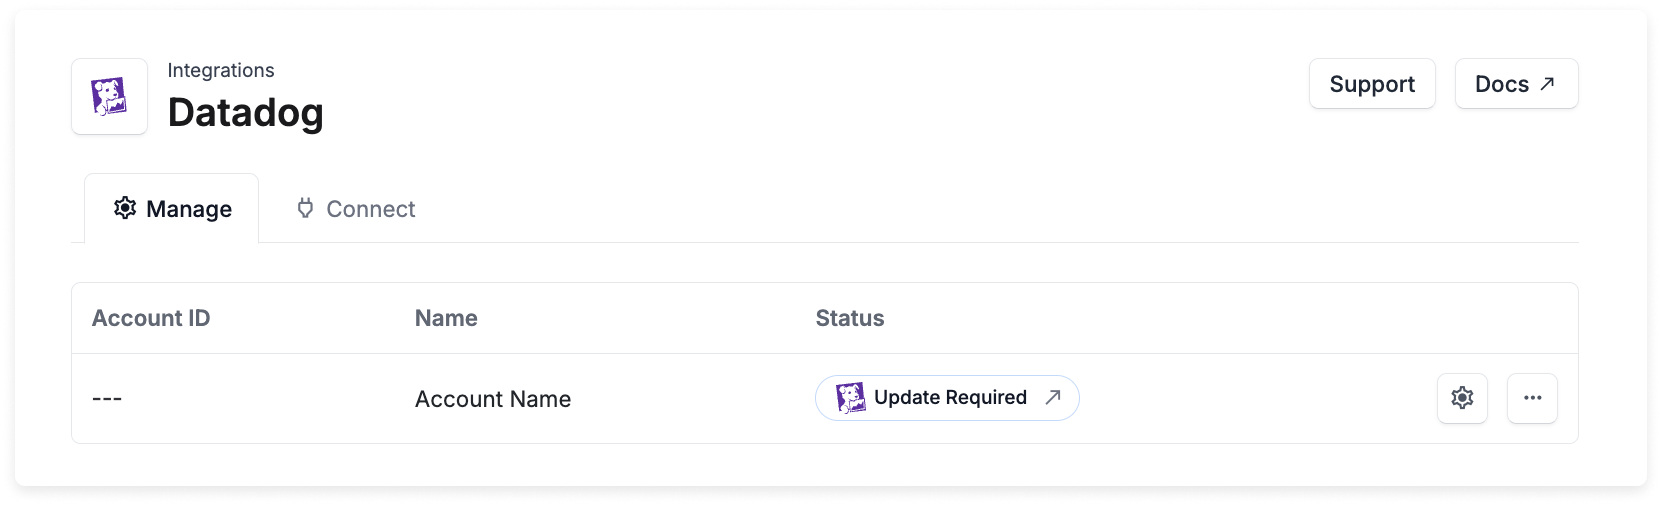
Datadog Reporting Dimensions
Within Cost Reports, Vantage will show cost data for at least the following services.Datadog services
Datadog services
- APM
- Application Security Management
- Audit Trail
- CI Visibility
- Cloud Cost Management
- Cloud Security Management
- Cloud Security Posture Management
- Cloud Workload Security
- Containers
- Continuous Profiler
- Database Monitoring
- Error Tracking
- Incident Management
- Infrastructure Monitoring
- LLM Observability
- Log Management
- Metrics
- Network Monitoring
- Network Performance Monitoring
- Observability Pipeline
- Real User Monitoring
- Sensitive Data Scanner
- Security Information and Event Management
- Serverless Monitoring
- Synthetic Monitoring
- Universal Service Monitoring
- Workflow Automation
- Organization (organization name)
- Category (e.g., APM ingested spans). At the Category and Subcategory levels, you can access information such as how much Datadog spend is covered by committed-use discounts or which individual Datadog container is contributing to overall Logging costs.
- Tag/Not Tagged (includes Datadog tags and virtual tags created in Vantage for this provider). The following additional tag is available for filtering and grouping:
datadog:organization:name: The human-readable organization name associated with the cost, allowing you to filter and group multi-org Datadog costs by organization name.
- Subcategory (e.g., Commitment or On Demand)
- Charge Type (e.g., Usage)
- Service (e.g., Database Monitoring)
Datadog Cost Tags (Usage Attribution Tags)
This feature is only available if you have a Datadog Enterprise plan with usage tags enabled.
- APM
- Container Services
- CI Pipeline
- Fargate
- Infrastructure Hosts
- Invocations
- Lambda
- Logs
- NPM
- Spans
- Synthetic Tests
- Time Series
- Tagged with key
- Tagged with Key where the value: is, is not, contains, does not contain
- Not Tagged
- Not Tagged with Key
Usage-Based Cost Allocation
Vantage assigns Datadog cost to tags using usage data from Datadog’s usage attribution API. For each cost category (e.g.,logs_ingested), Vantage matches the cost to a corresponding usage key in your usage attribution export and splits the cost across tag values based on each value’s share of usage.
Vantage tries several usage keys and patterns when matching cost categories to usage data, so when your usage is tagged (e.g., by
team), that data is used to split the cost. As a result, more cost appears under the correct tags and less is left as untagged, giving you better visibility by team and other dimensions in Cost Reports and Virtual Tags without changing your total Datadog spend.Datadog Pricing in Vantage
For certain services, Datadog prices based on the 95th to 99th percentile (p95/p99) of usage rather than daily usage. For example, APM is billed on the 99th percentile of the number of hosts you have running at any given time. In Vantage, Datadog costs are realized on the first day of the month. As the month progresses, you might notice that costs retroactively increase or decrease based on your usage. Because these costs are always realized on the first of the month, when you compare previous periods for services that price on the p95/p99 of usage, you’ll always have the same comparison dates. For services that do not price on p95/p99, Vantage shows costs realized per day, when the accompanying usage data is available. In the below visual example, a Cost Report is filtered to all Datadog costs. The date grouping is set to Daily. If you select a service row in the table, that service is isolated on the graph, and you can see how the service is priced. In this example, Log Management has accrual data and prices daily; whereas, Containers is priced based on the p95/p99 of usage, and costs are realized on the first of the month.