Add an Annotation
You can add annotations directly from the chart on a Cost Report or Segment Report, or from the Annotations sidebar.- From a Report Chart
1
From any report chart or graph, hover over the chart’s bars or line and select the date point you want to annotate.
2
The Annotations sidebar is displayed on the right side of the screen. Your username is displayed as well as the date that corresponds with the selected date point on the chart. Enter a comment for the annotation.
3
To save the annotation, click the arrow icon on the bottom right of the comment box.
When you manually create an annotation, a corresponding issue is also created.
View and Edit Annotations
1
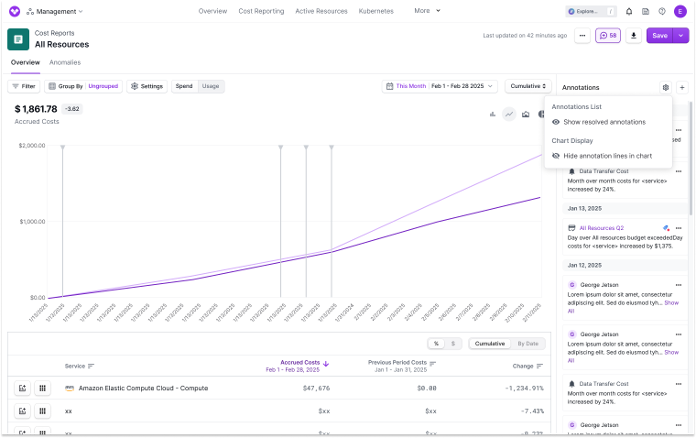
To view an annotation, from the top right of any Cost Report or Segment Report, click the Annotation icon (looks like a word bubble).
2
The Annotations sidebar is displayed, with the most recently added annotation at the top of the list. A vertical line is also displayed on the report chart or graph for dates that have an existing annotation.
3
To edit the annotation, click the ellipses (…) on the top right of the annotation, then select Edit.
4
Select a new date from the date picker and/or edit the text in the comment field.
5
To save the annotation, click the arrow icon on the bottom right of the comment box.
Hide Annotations
1
From the top right of any Cost Report or Segment Report, click the Annotation icon (looks like a word bubble).
2
From the top right of the Annotations pane, click the Annotations Settings icon (looks like a gear).
3
You can toggle an annotation’s visibility in the Chart Display section.
Delete an Annotation
1
To delete an annotation, from the top right of any Cost Report or Segment Report, click the Annotation icon (looks like a word bubble).
2
The Annotations sidebar is displayed. Click the ellipses (…) on the top right of the annotation, then select Remove > OK.
Resolve an Annotation
1
To resolve an annotation, from the top right of any Cost Report or Segment Report, click the Annotation icon (looks like a word bubble).
2
The Annotations sidebar is displayed. Click the ellipses (…) on the top right of the annotation, then select Mark as Resolved.
View Resolved Annotations
By default, reports hide resolved annotations from the annotations list and chart or graph.1
To view resolved annotations, click the Annotation icon at the top right of the screen.
2
From the Annotations sidebar, click the filter icon (next to the New button), then click Show Resolved. Resolved annotations are displayed in both views.
Share an Annotation
1
To share an annotation with a teammate, from the top right of any Cost Report or Segment Report, click the Annotation icon.
2
The Annotations sidebar is displayed. Click the ellipses (…) on the top right of the annotation, then select Copy Link. A link is added to your clipboard, which you can use to share with a teammate.
View Corresponding Issues
When you manually create an annotation, a corresponding issue is also automatically created. Budget Alert annotations also have a corresponding issue. Cost Alert annotations are linked to the Cost Alert instead, so their menu shows Go to Cost Alert rather than Go to Issue.1
To open the corresponding issue, click the ellipses (…) on the top right of the annotation.
2
Then, select Go to Issue.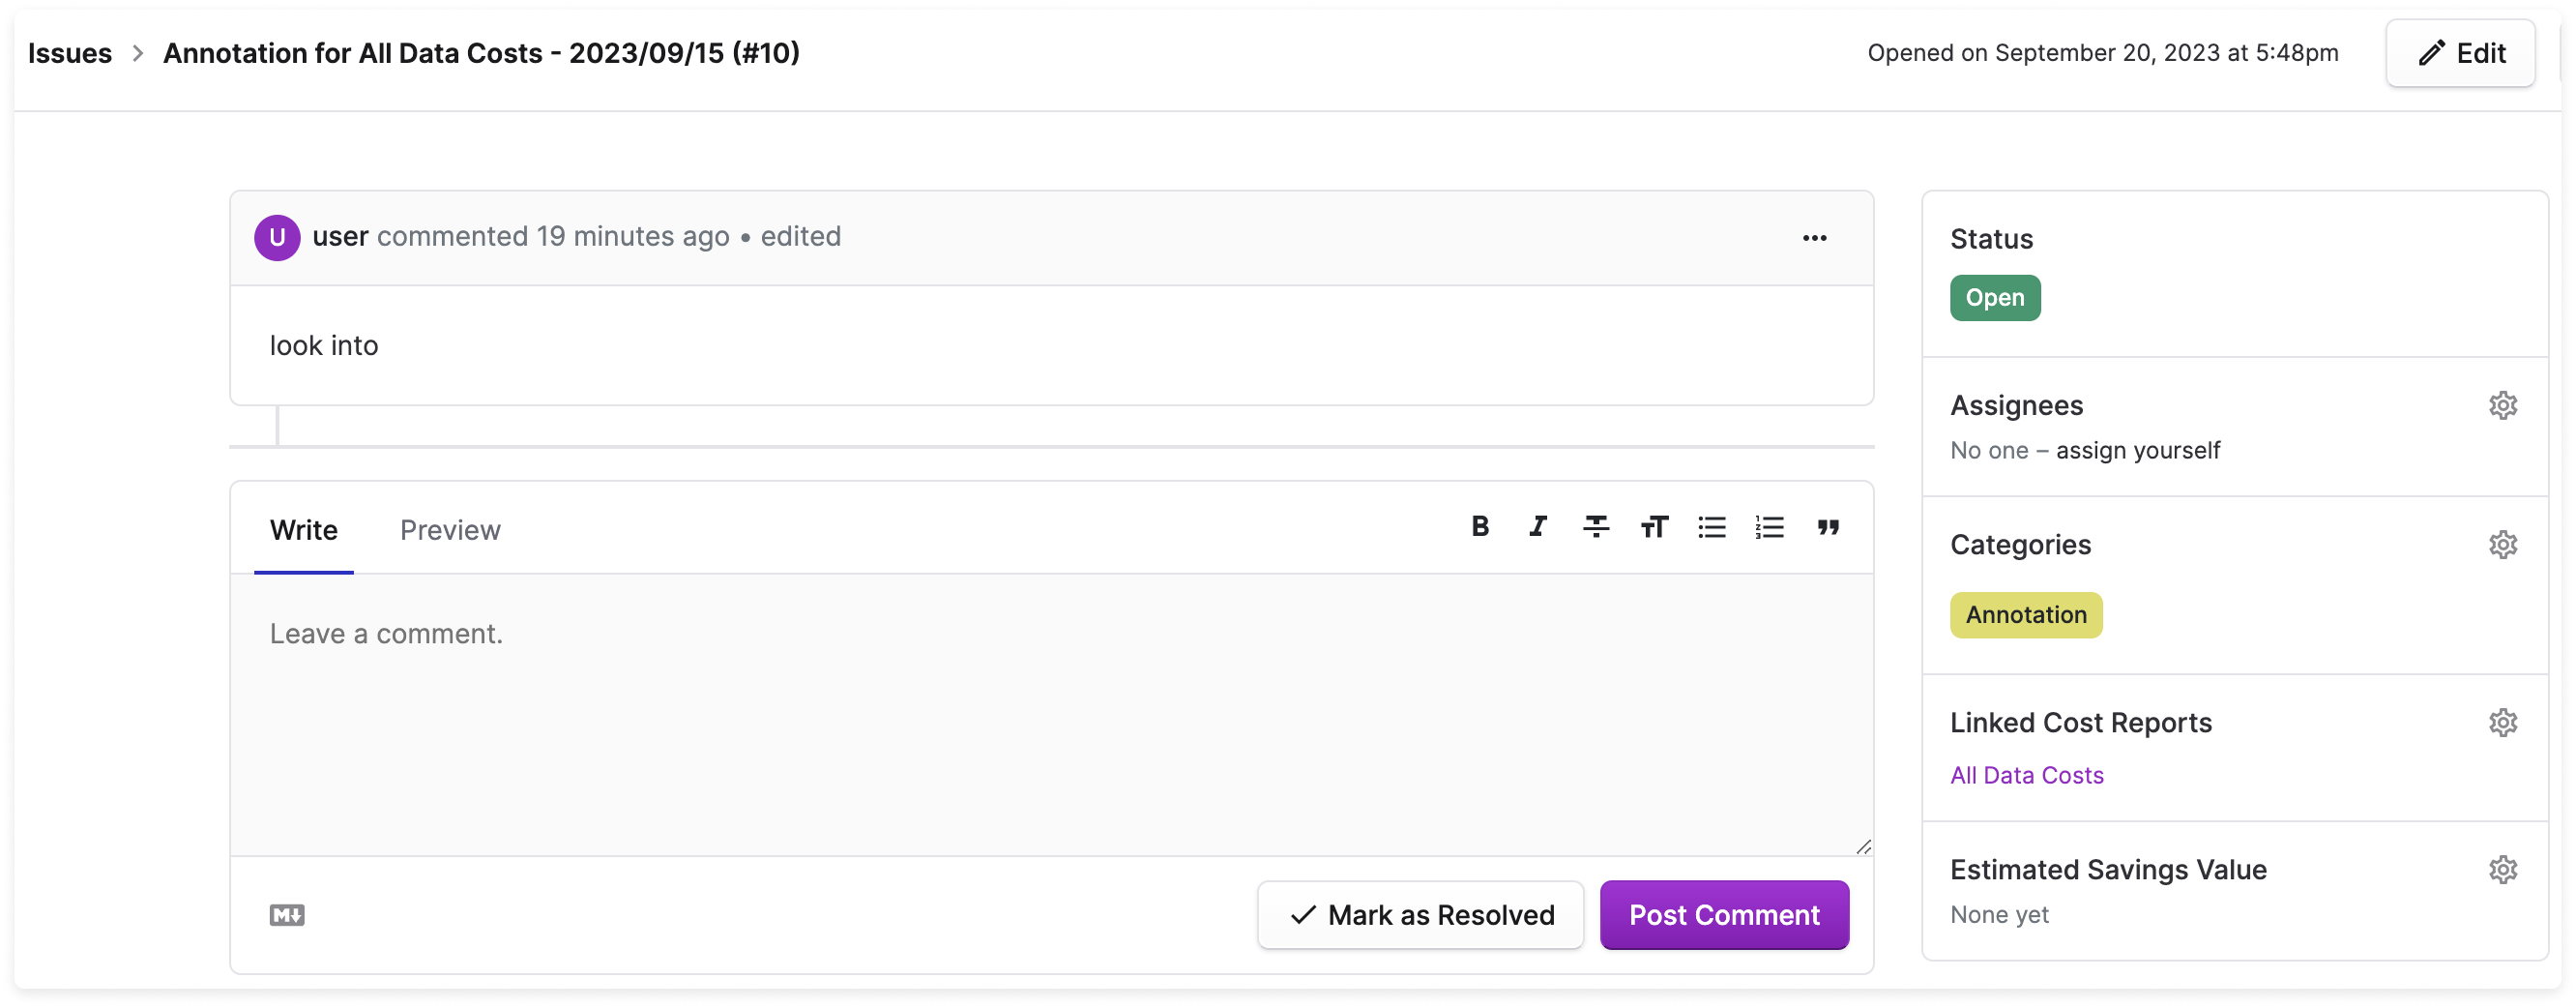
Cost Alert Annotations
When a Cost Alert is triggered, an annotation is added to the corresponding Cost Report. This happens even if you do not configure external notification delivery through email, Slack, Microsoft Teams, or Jira. Cost Alert annotations show details about the alert event, such as the alert title, the grouping that triggered the alert, the change amount, and the comparison interval. From the annotation menu, select Go to Cost Alert to view or edit the alert configuration. See Cost Alerts for details on how to set up Cost Alerts.If Jira delivery is configured for the Cost Alert, the annotation also includes a link to the Jira issue. If Jira delivery is not configured, no Jira issue is created, but the Cost Alert annotation still appears on the report.
Budget Alert Annotations
When a Budget Alert is triggered, an annotation is added to the corresponding Cost Report. See the Budget Alerts documentation for details on how to set up Budget Alerts.Troubleshooting
Why do I see Go to Cost Alert instead of Go to Issue?
Why do I see Go to Cost Alert instead of Go to Issue?
The annotation was created by a Cost Alert. Cost Alert annotations are connected to the alert event, so the menu links back to the Cost Alert configuration. If the alert was also delivered to Jira, the annotation includes a separate Go to Jira Issue option.
Why do I see an annotation without an email, Slack, Teams, or Jira notification?
Why do I see an annotation without an email, Slack, Teams, or Jira notification?
Cost Alerts can be configured without external delivery channels. When a Cost Alert triggers, Vantage still adds an annotation to the associated Cost Report so the event is visible during report review.
Why did an annotation appear on an earlier date?
Why did an annotation appear on an earlier date?
Alert-generated annotations use the date of the cost event that triggered the alert. Cloud providers can update billing data after the original usage date, so an alert may be detected later while the annotation appears on the date the cost change occurred.