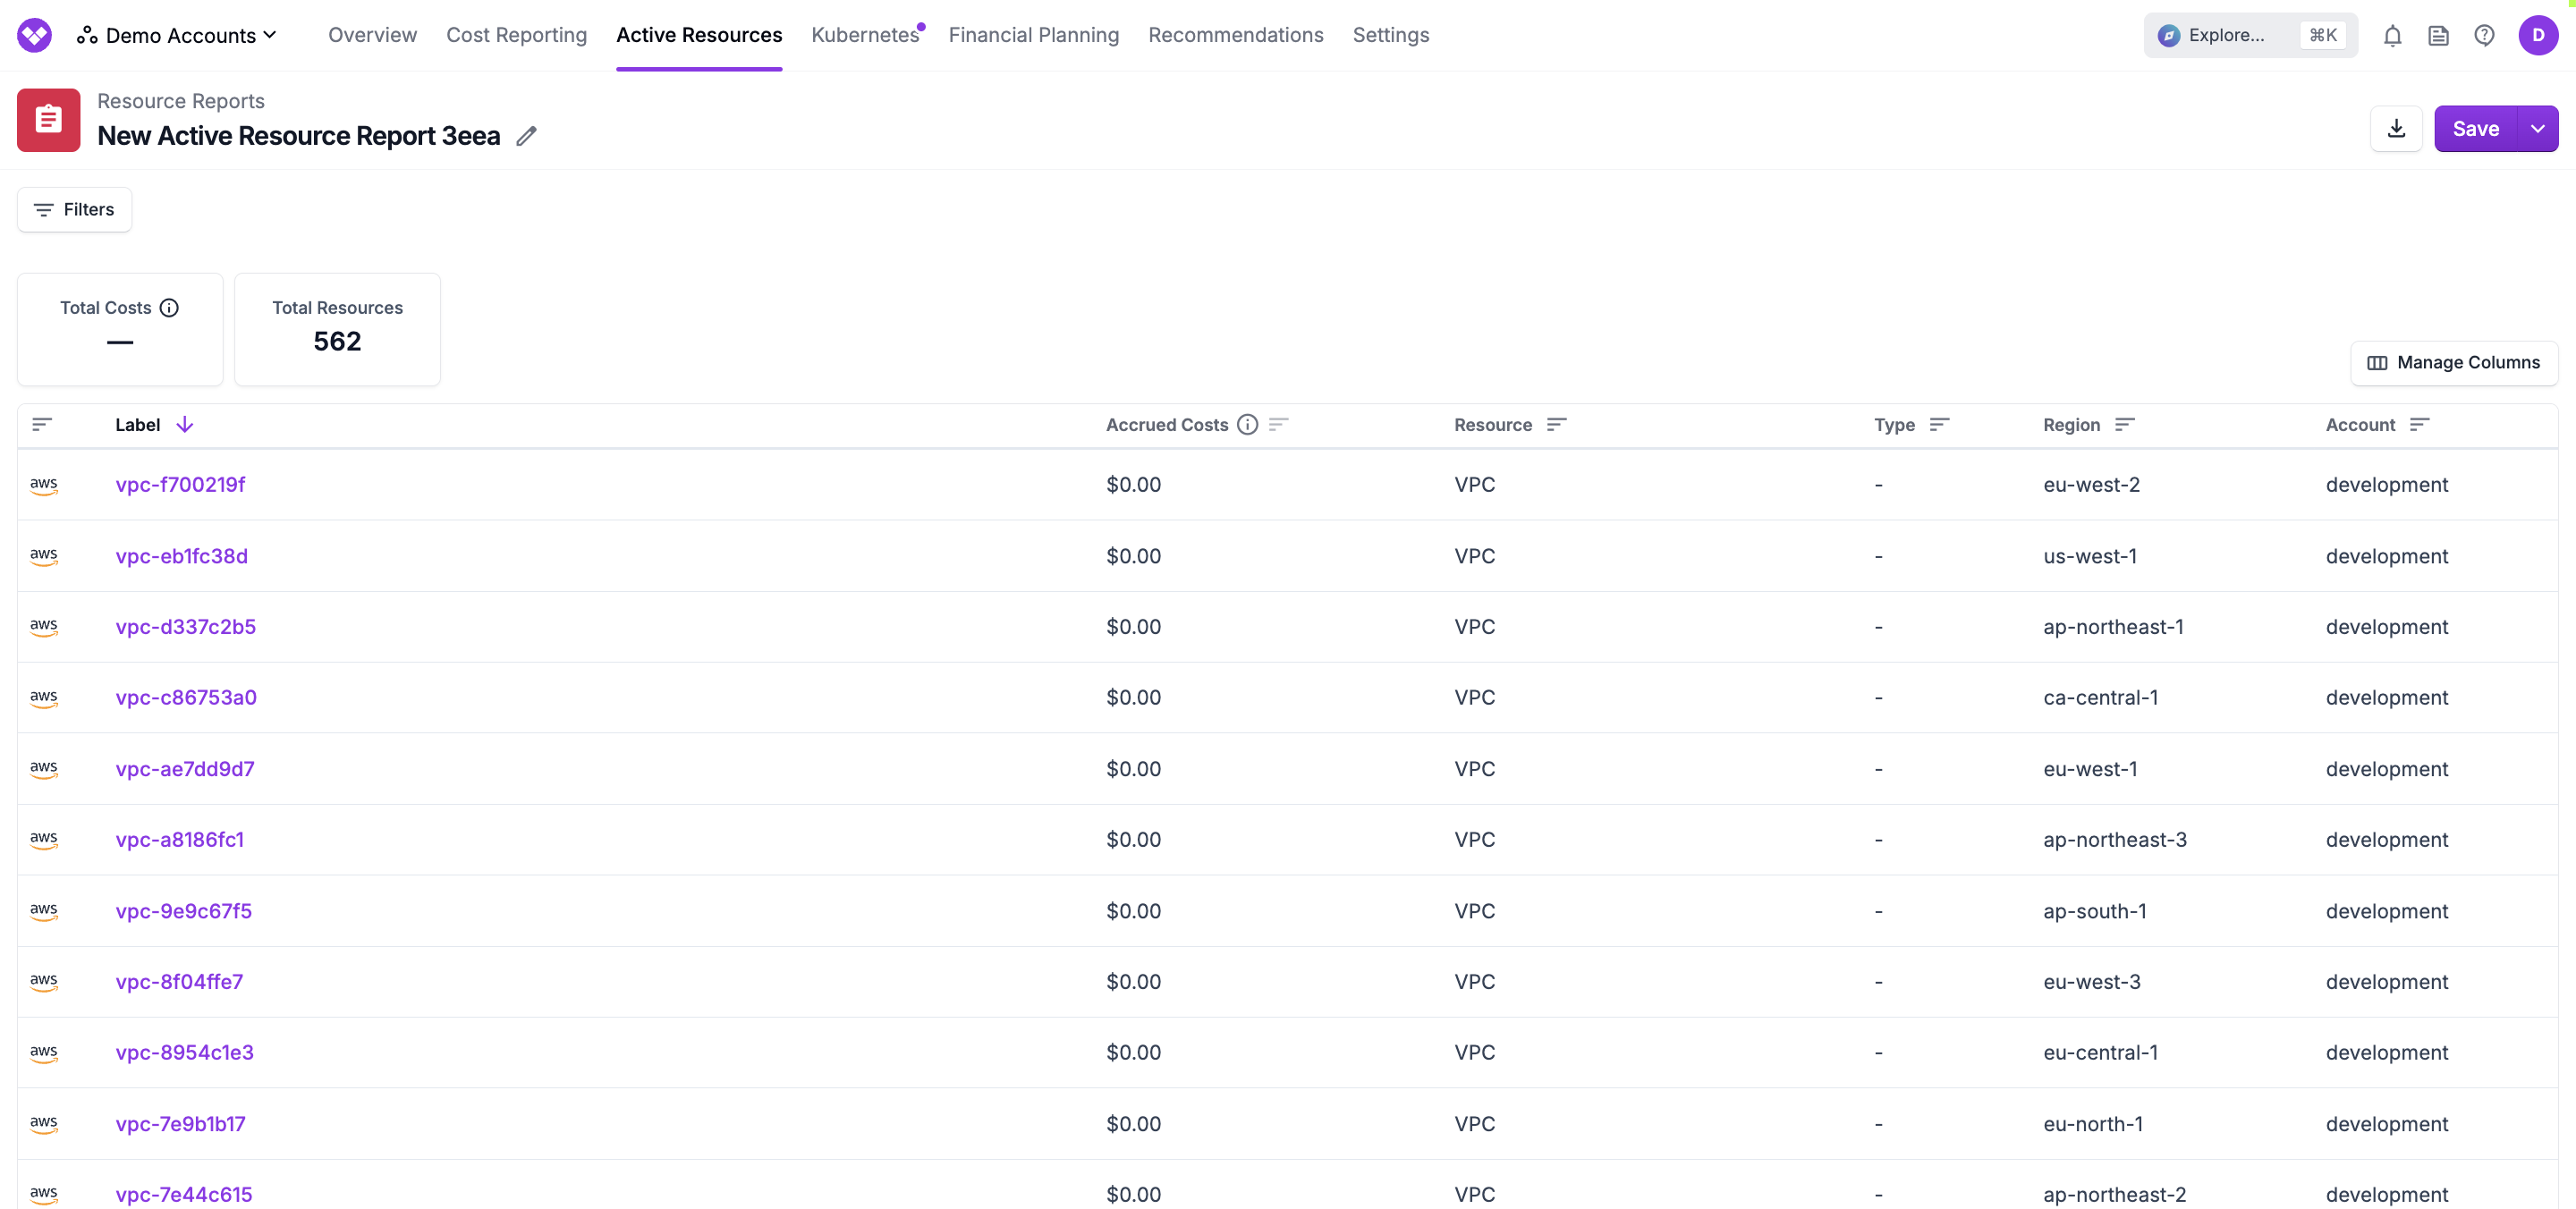
For supported providers, Vantage looks for active resources within your account. An active resource is a resource, such as a virtual machine, that is currently generating costs within a cloud account. This is in contrast to resources that are included in billing but may no longer be live. Examples of active resources include items like Amazon S3 buckets, Azure Load Balancers, Snowflake queries, Confluent clusters, etc. You can create resource reports to see filtered views of your active resources. These reports provide visibility into all the currently operational resources within your account and the associated costs incurred by each resource. Reports include filterable dimensions, such as account, tag, region, service, and service-specific metadata.Documentation Index
Fetch the complete documentation index at: https://docs.vantage.sh/llms.txt
Use this file to discover all available pages before exploring further.
Active resource views are currently supported for AWS, Azure, GCP, Kubernetes, Snowflake, MongoDB, Confluent, PlanetScale, Linode, ClickHouse Cloud, Datadog, and Anthropic.
AWS Active Resources
Vantage shows only active resources that have an associated IAM role. One common source of confusion is when an organization has only a root/management account with an IAM role. To view active resources from each member account, create an IAM role for each member account. As you create each additional IAM role, the member account’s resources are automatically added to the active resource inventory. See the AWS integration documentation for details. Not every AWS service is supported for resource-level costs; however, most services that incur costs are supported. To see the full list of services for which there are resource-level costs, see the documentation on supported AWS services.Azure Active Resources
To see the full list of supported Azure services, see the Azure documentation.Active Resources are not available for Azure CSP integrations. Azure does not expose any list or describe resource APIs through Partner Center to provide resource metadata.
GCP Active Resources
To see the full list of supported GCP services, see the GCP documentation.Kubernetes Active Resources
A Kubernetes managed workload is a higher-level abstraction than a pod that automatically manages pod objects on your behalf. Vantage currently supports Deployments, StatefulSets, DaemonSets, Jobs, CronJobs, and ArgoCD Rollouts and syncs these managed workloads as active resources in your account. When available, pods are grouped by controller, and you can view and filter on the following metadata:- Controller name
- Controller type
- Cluster
- Namespace
- Controller labels
Other Available Active Resources
The following active resources are available for the additional providers listed below.| Provider | Available Active Resources |
|---|---|
| Snowflake | Snowflake queries |
| MongoDB Atlas | MongoDB Atlas clusters |
| Confluent | Confluent Kafka clusters |
| PlanetScale | PlanetScale databases |
| Linode | Linode Instances, Kubernetes Clusters, Volumes, Object Storage, Images, and NodeBalancers |
| ClickHouse Cloud | ClickHouse Cloud services |
| Anthropic | Anthropic API keys |
| Datadog | Custom metrics |
View Active Resources
Active resources are synced for each workspace at least once every 24 hours. Vantage syncs all tags specific to a service.
The Services screen is displayed, which contains each resource by name (e.g., CloudFront Distributions, Azure Databricks Workspaces, etc.), the total number of active resources, and accrued costs for each resource. Select a resource from the parent list to see a list of all resources within that resource group. In the below example, the NAT Gateways resource is selected from the list.
The resource is displayed along with a detailed view of its costs over time. In the below image, the selected AWS NAT Gateway resource is displayed along with associated metadata.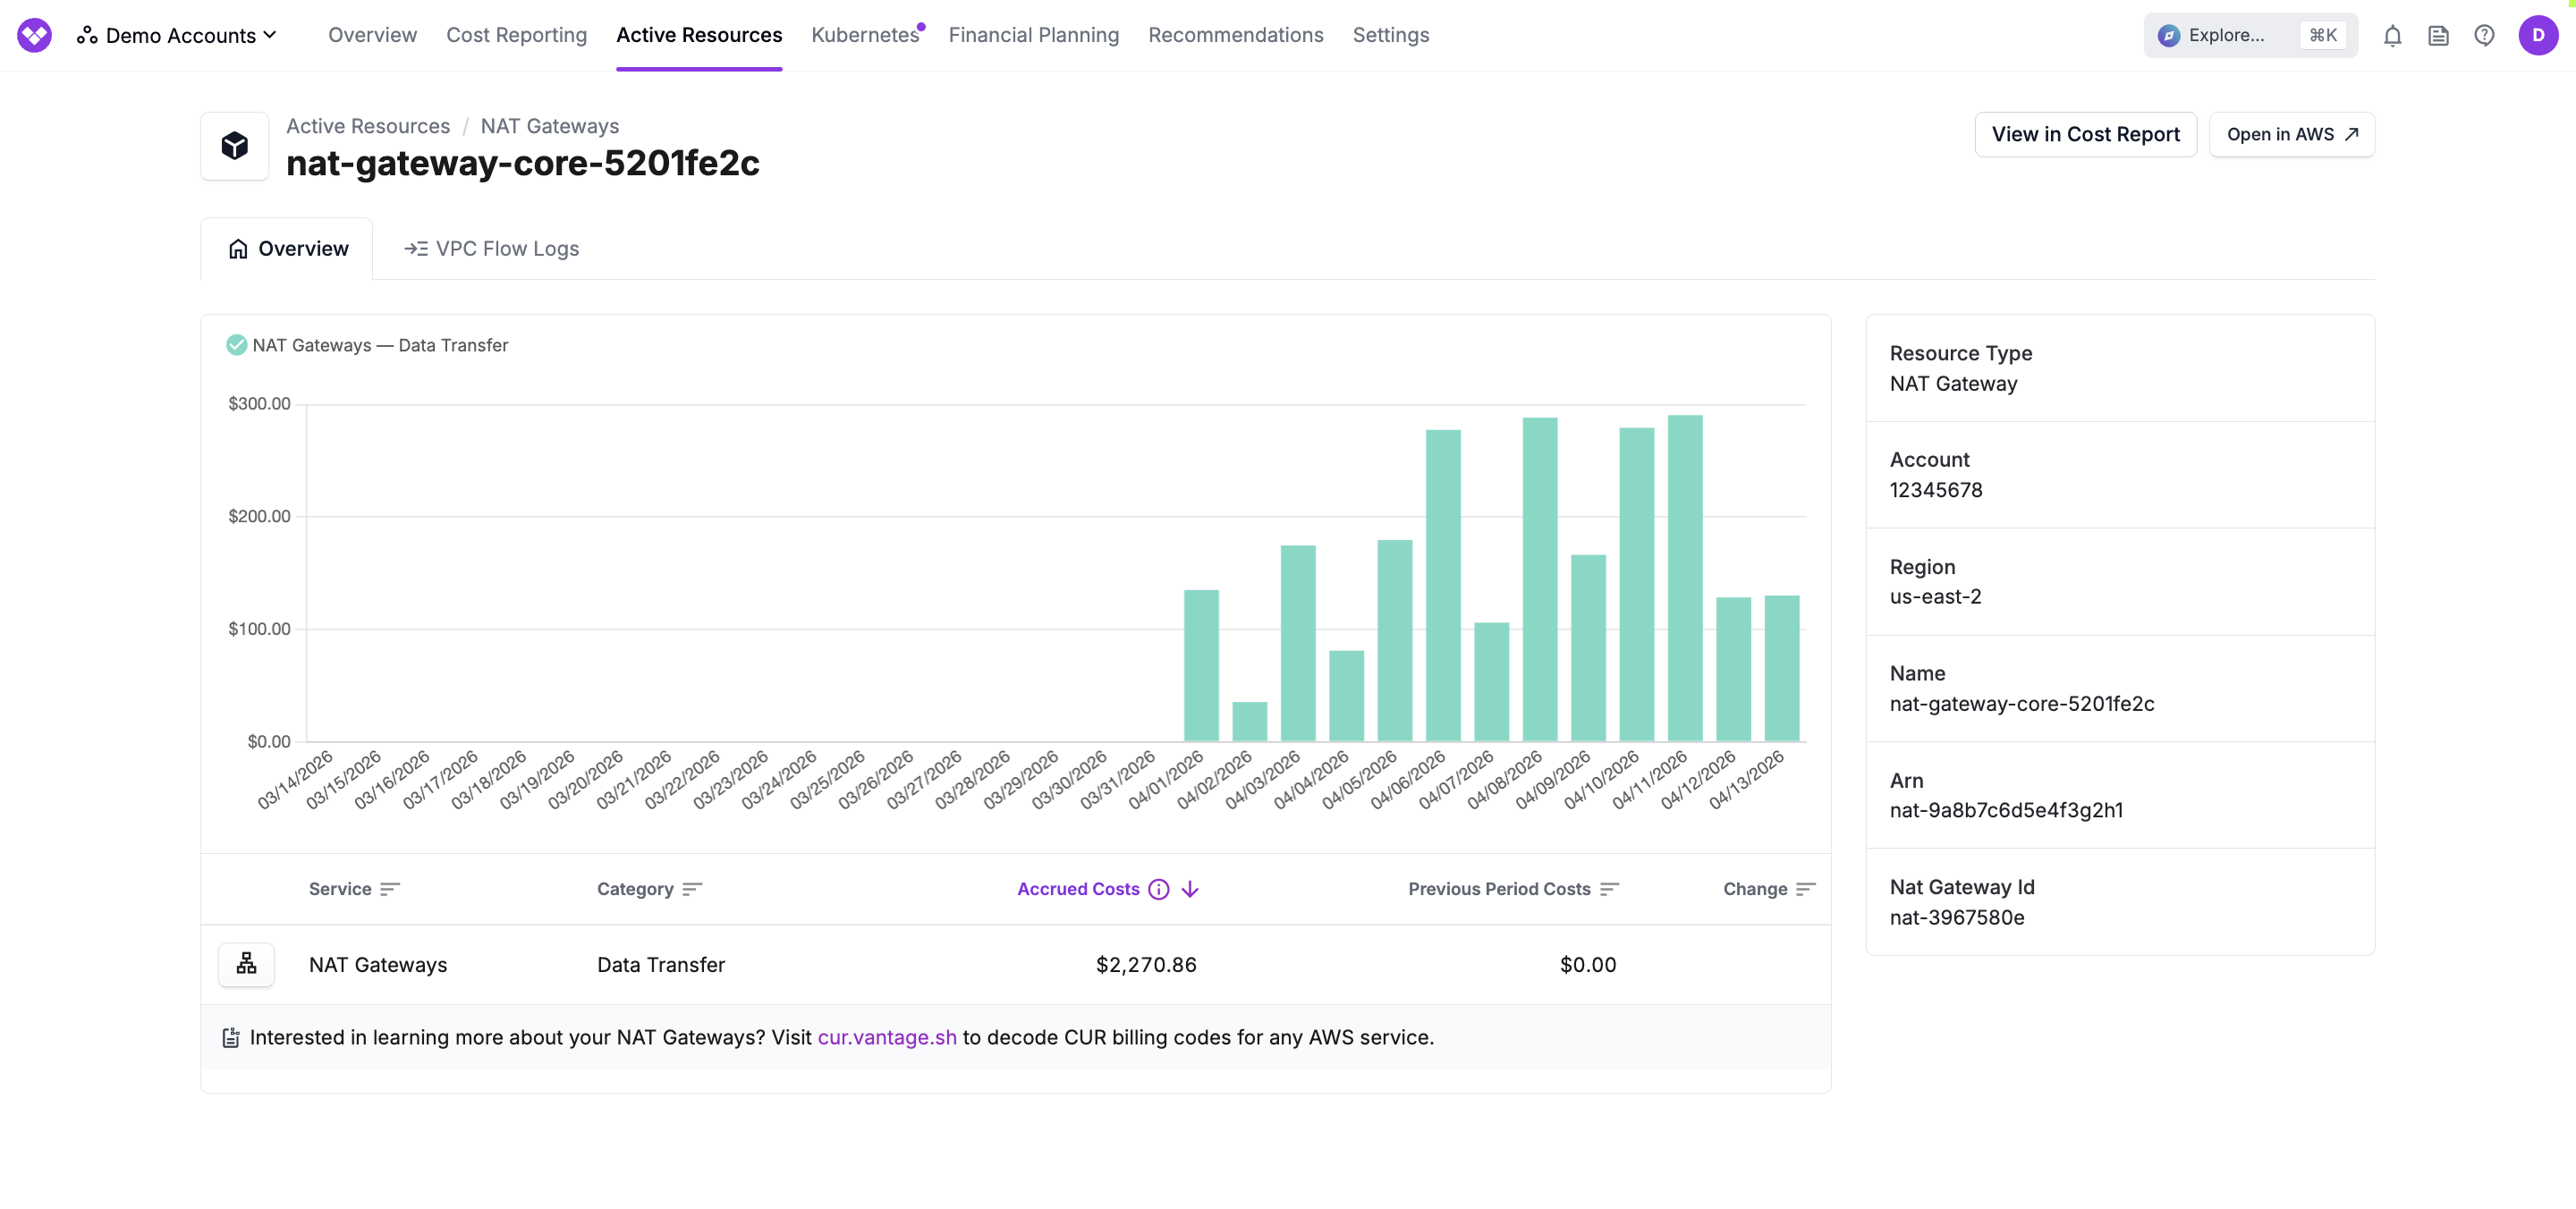

When available, a View in Cost Report button appears at the top of the active resource detail page, linking directly to the default Cost Report filtered by the resource’s provider, service, and resource ID. An Open in [Provider] button also appears, linking directly to the resource in the provider’s console (e.g., AWS Console, Azure Portal, or GCP Console). The Open in [Provider] button is available for most AWS, Azure, and GCP resources, as well as PlanetScale databases. Availability depends on the resource type and whether the necessary metadata (such as region or resource identifier) is present.
Create a Resource Report
Create a resource report to filter by specific resources or groups of resources. Create detailed reports, including reports that show:- Resources across AWS services that match a certain AWS tag
- Resources within a specific AWS member account
- All Amazon EC2 instances that are a certain type, like
m5.large - All Snowflake queries belonging to a specific label
From the left navigation, click Resource Reports. You can create new reports and rename your existing reports from this page. The All Active Resources Report is provided by default.
From the top left of the resource list, click Filters. The Filters panel is displayed.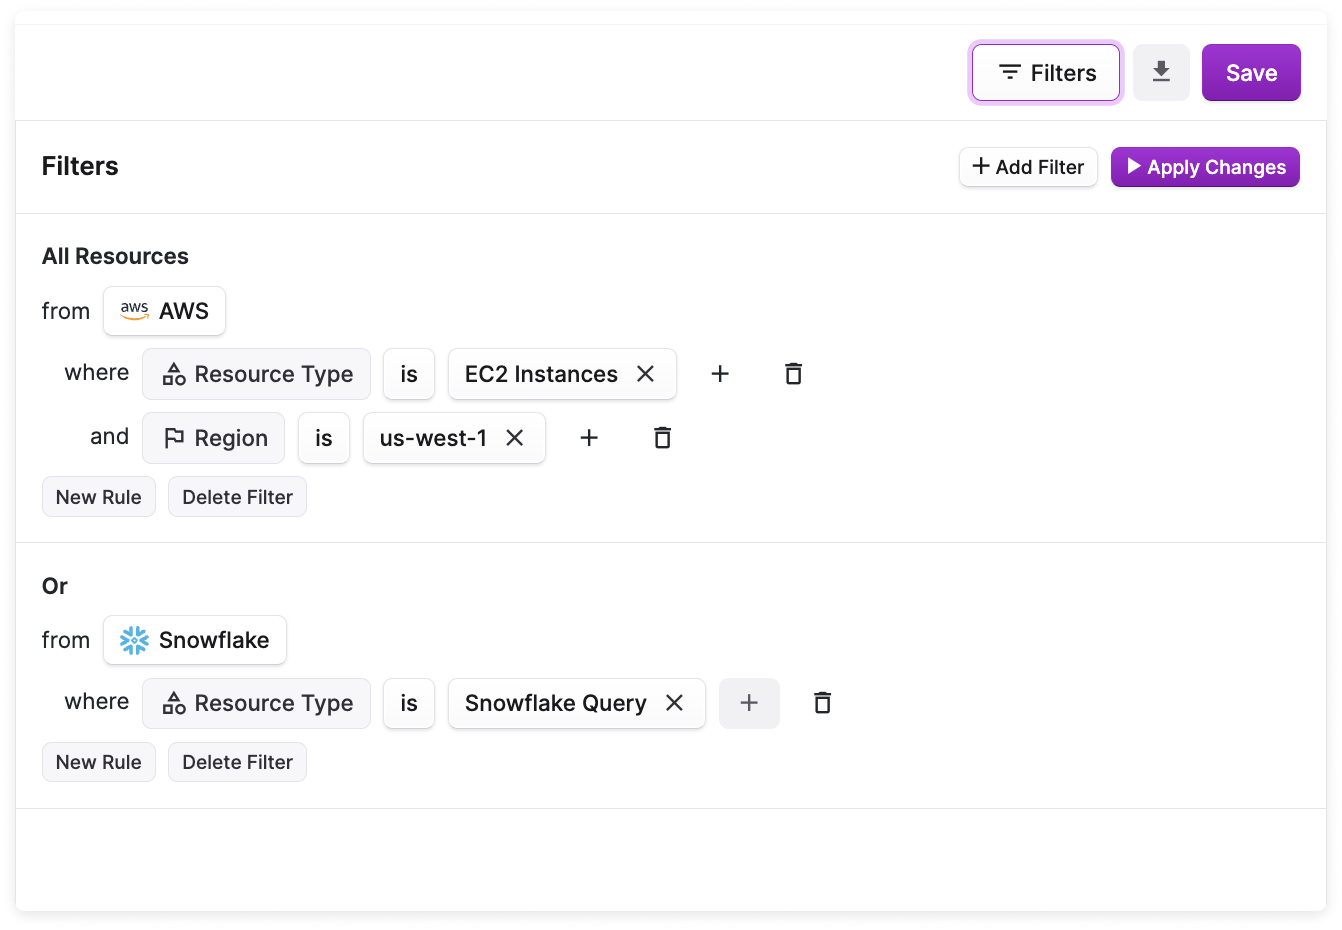
- Select a Provider (e.g., AWS).
- Click New Rule, then select a filter category, like Region. (See the section below for details on available filter options.)
- Depending on the filter criteria, select an operator (e.g., is, is not, contains).
- Select a value (e.g., Region is eu-west-1 ).
- Click New Rule to add additional criteria to the same filter. Results are displayed where both rule 1 AND rule 2 are true.
- Click + Add Filter to add a new filter set. Results are displayed where either filter 1 OR filter 2 are true.
- At the top of the Filters panel, click Apply Changes.

Customize a Resource Report
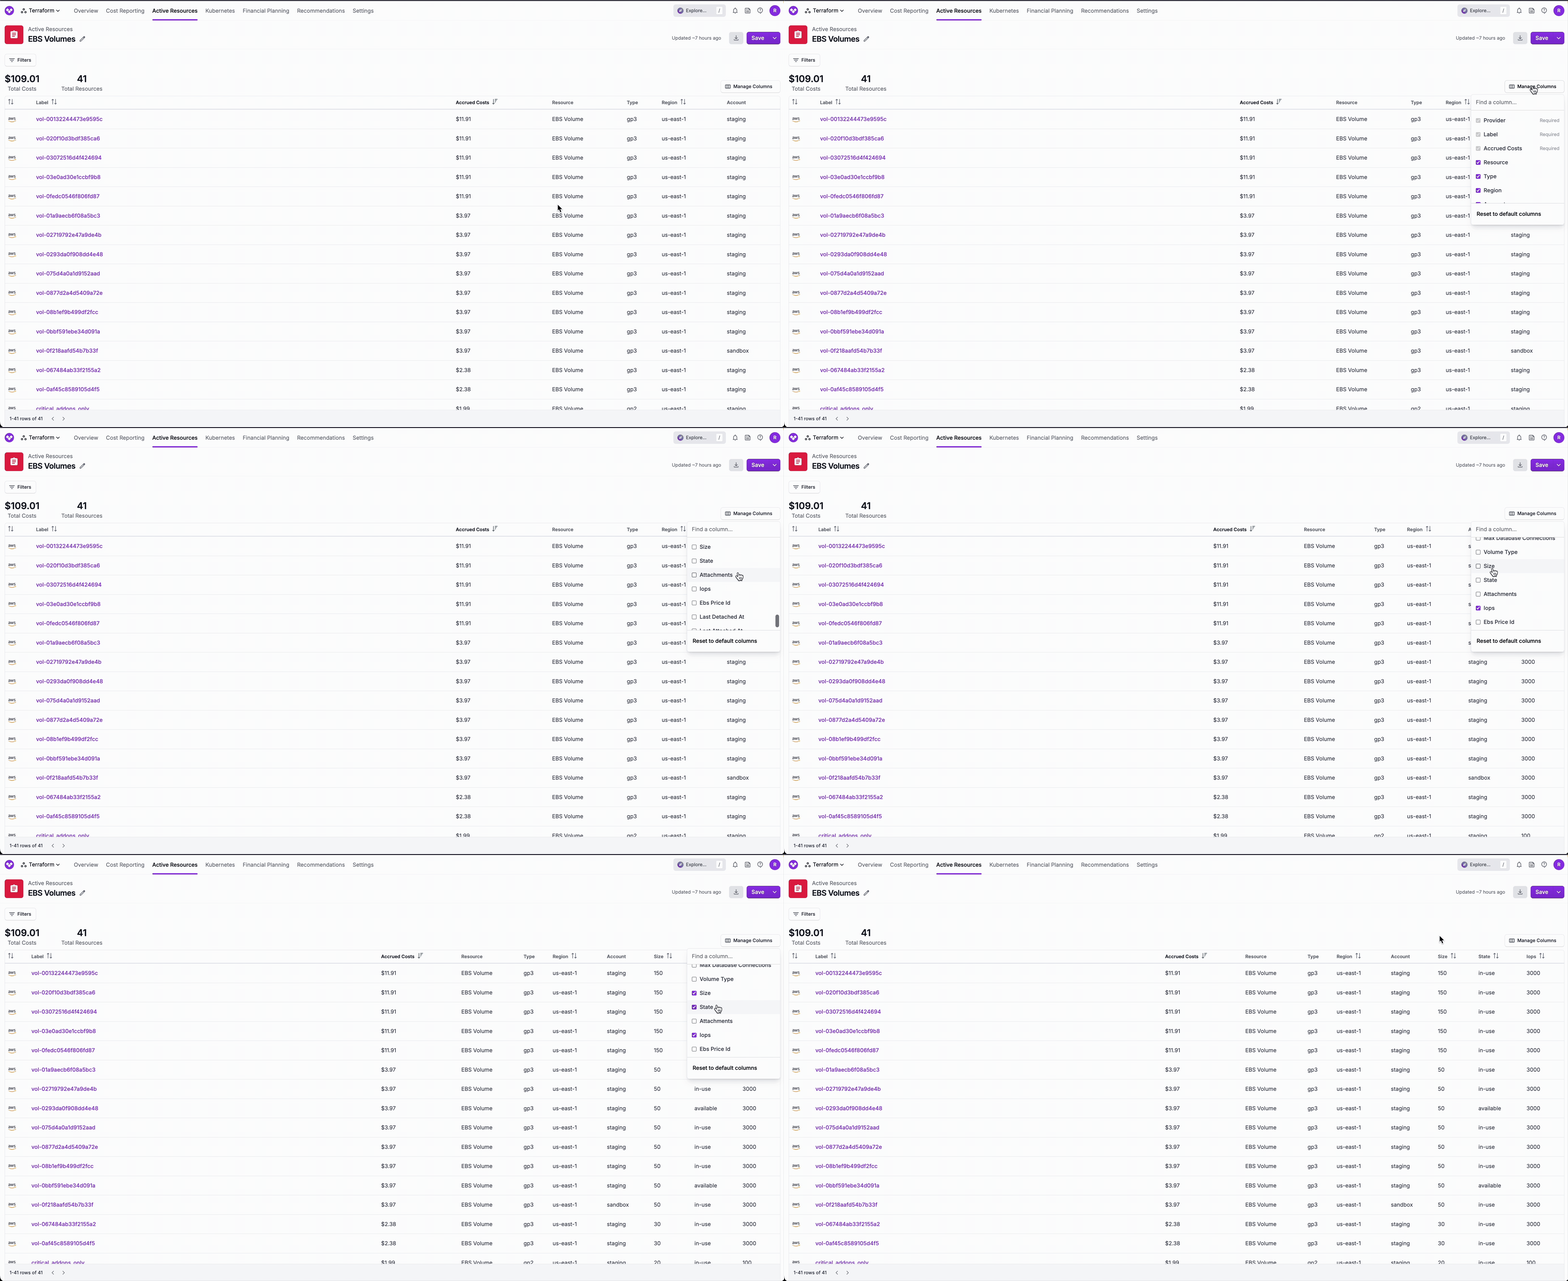
You can customize which columns are displayed in your Resource Reports, such as resource-specific metadata fields, as well as arrange the columns in any order.Resource-specific metadata fields are available only when a Resource Report is filtered to a single service. Reports that span multiple services include only the default columns (i.e., Label, Accrued Cost, Resource, Type, Region, and Account).
Select Columns
To select which columns are displayed on your Resource Report:From the top menu, select Active Resources > Services, then select a service. (Alternatively, filter a Resource Report to a single service, such as EC2.)
Reorder Columns
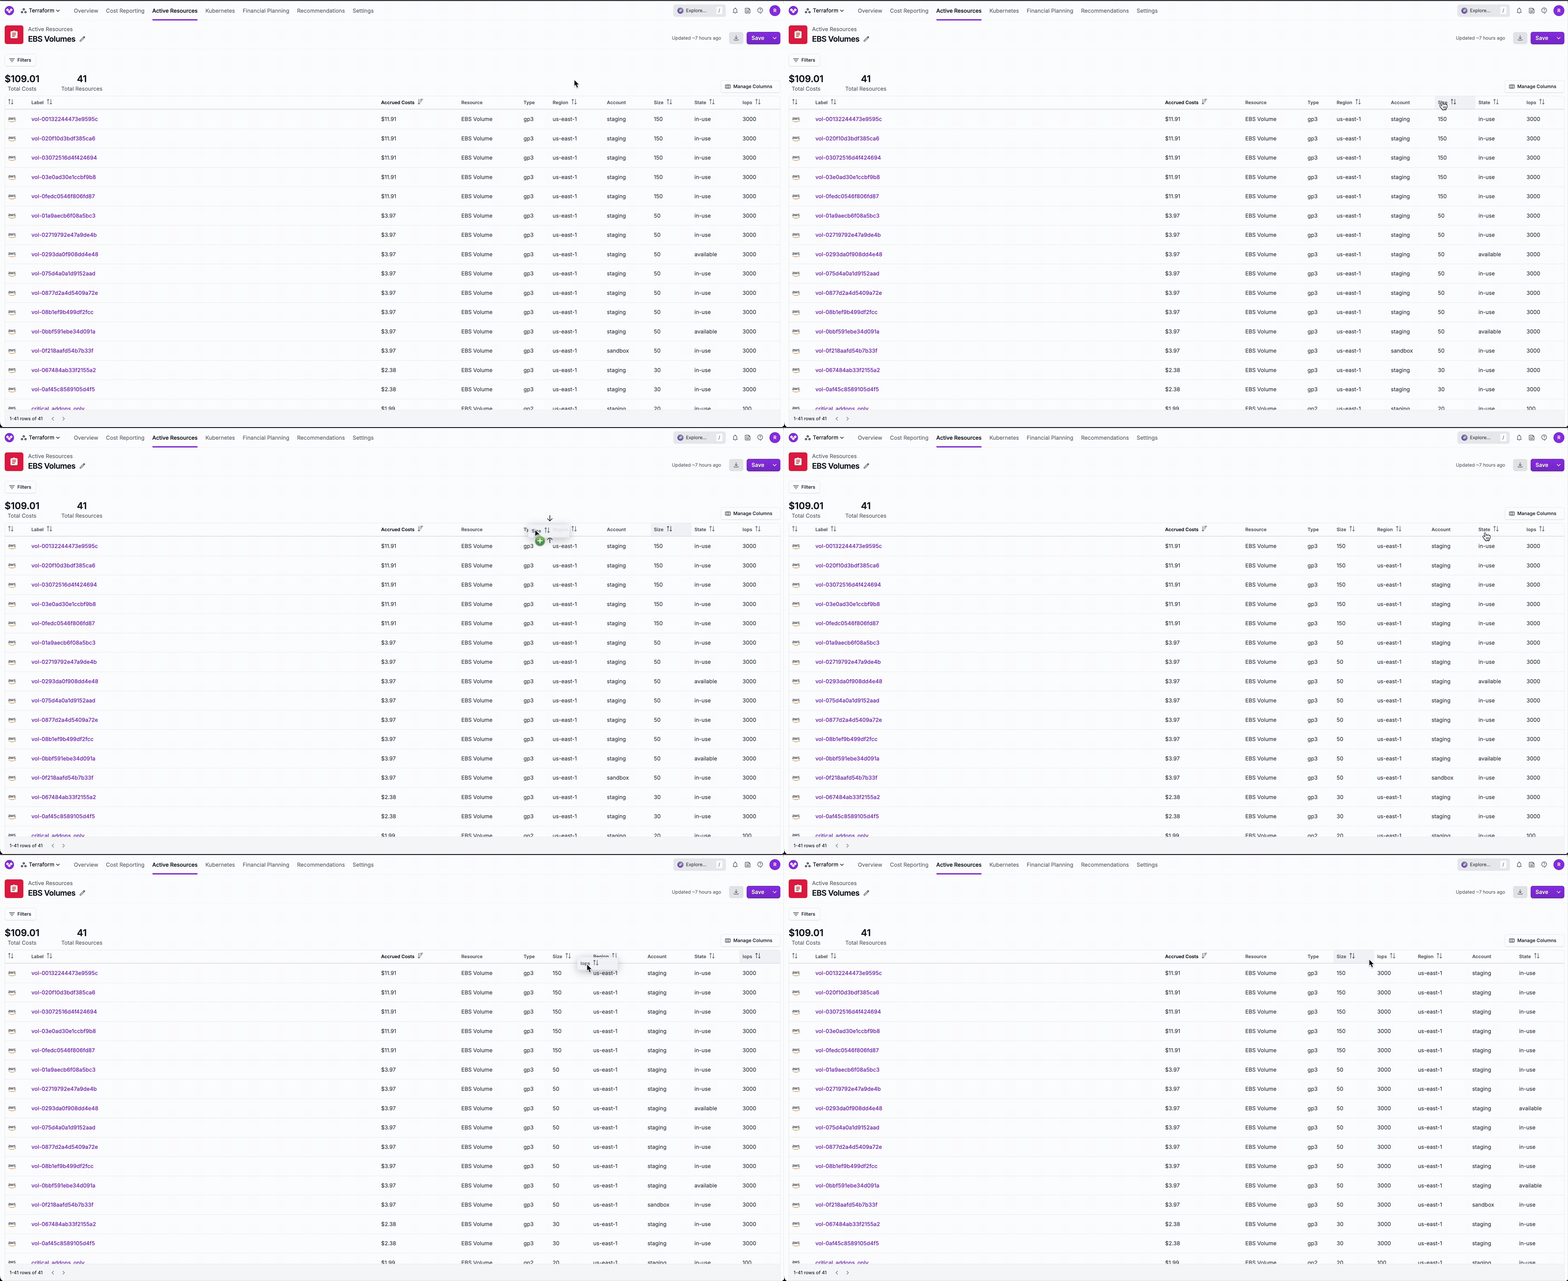
To reorder the columns of your Resource Report:Click and drag a column header to the position between two existing columns. Arrows are displayed to indicate where the column will be inserted.
Sort Columns
To sort a column in a Resource Report, click the arrow next to a column name in the column header. The active sort column icon is highlighted in green, with an arrow indicating the sort direction.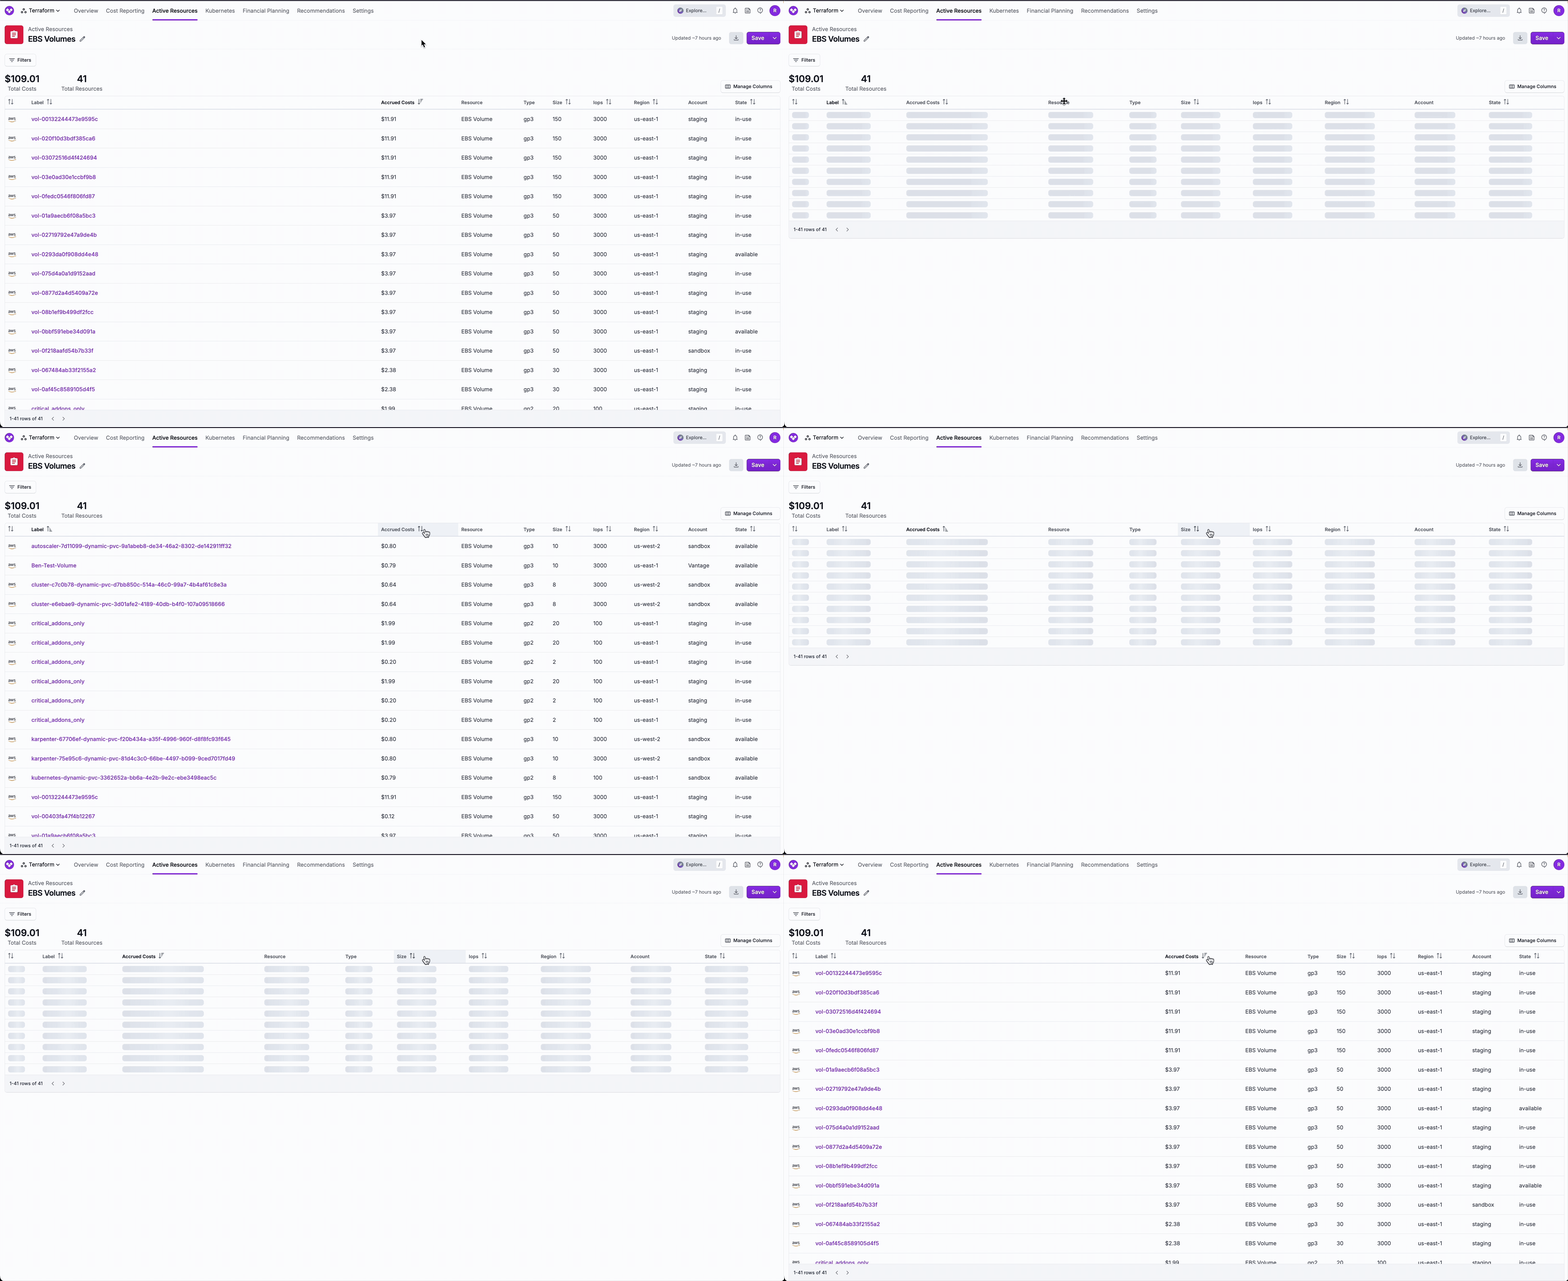
Resource Report Filters
The following filters are available for resource reports.| Filter | Provider | Examples |
|---|---|---|
| Account | AWS, GCP | AWS or GCP account name (e.g., production) |
| Billing Account | AWS | AWS billing account name |
| Label | All providers | The resource’s label (i.e., name) |
| Metadata | All providers | Specific to each resource type (e.g., AWS S3 buckets object count; Azure Load Balancers provisioning state; GCP Dataflow Jobs create time; Confluent Kafka cluster type; MongoDB Atlas cluster deployed region; PlanetScale database branches count; Snowflake query invocations; Kubernetes workload namespace) |
| Not Tagged | All providers | Filter to see resources not tagged with a specific tag key or any tag key |
| Region | AWS, Azure, GCP, Linode | us-east-1, ap-northeast-2, eastus, us-east4, us-lax |
| Resource group | Azure | The Azure resource group name |
| Resource type | All providers | EC2 instances, S3 buckets, Confluent Kafka clusters, Snowflake queries, etc. |
| Subscription | Azure | The Azure subscription name |
| Tag | All providers | Filter to see resource by a specific tag key or tag key/value; Virtual Tags for only AWS and Azure at this time |
| UUID (ARN for AWS) | All providers | The unique provider ID (i.e., ARN for AWS) for the resource |
Export Resource Report
To export a resource report, click the export button (looks like an arrow pointing down) on the top right of a resource report (does not need to be saved). The resources in the report are exported in a ZIP file with a CSV file per active resource type. Each row includes an active resource along with its cost and metadata. Select one or more Vantage user emails to send the report. Then, click Export. It may take a few minutes for the email to be sent.Additional Active Resource Views
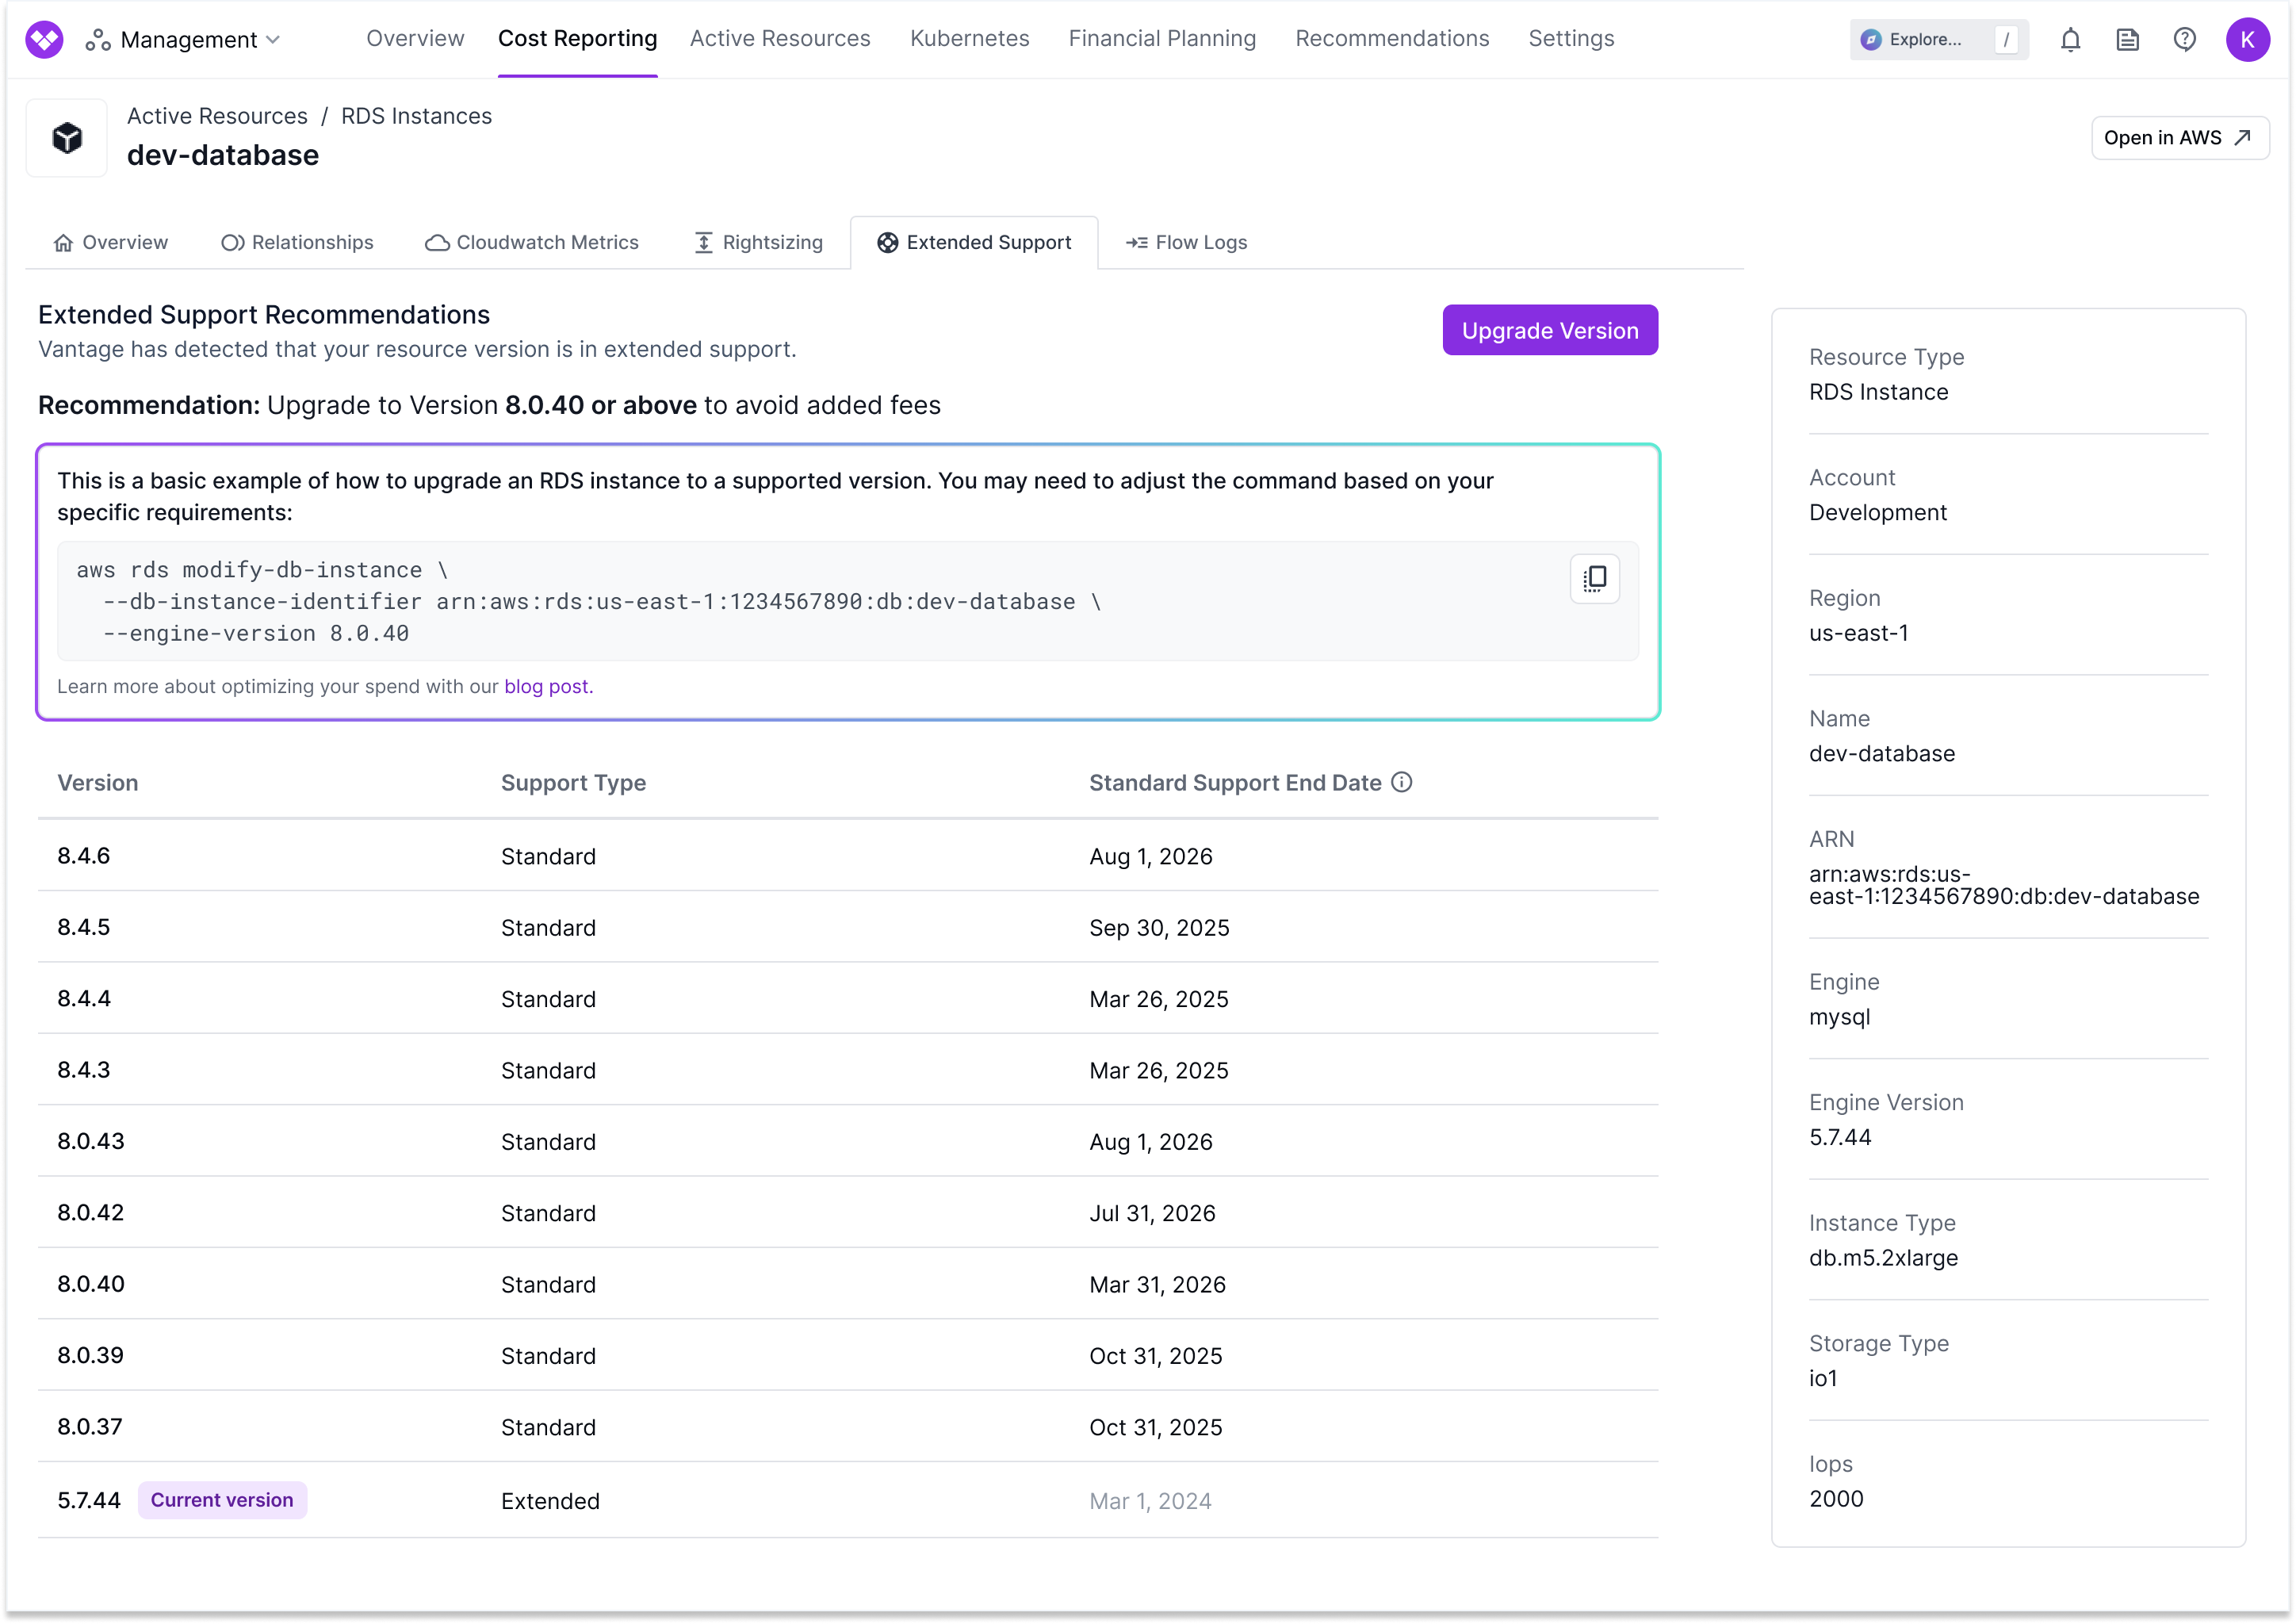
The following tabs are available for specific resources on the Active Resources screen. These tabs provide additional resource-specific information. Some of these tabs may also display Cost Recommendations relevant to the specific resource you are viewing. In these cases, a recommendation card is displayed at the top of the tab containing a description of the recommendation and remediation steps. The remediation workflow can include CLI commands, links to provider console actions, a list of manual steps, and references to Vantage blogs. When displayed within a specific resource tab, like Rightsizing or Extended Support, the CLI command will automatically include the exact resource ARN of the resource you are viewing.Billing Code Descriptions
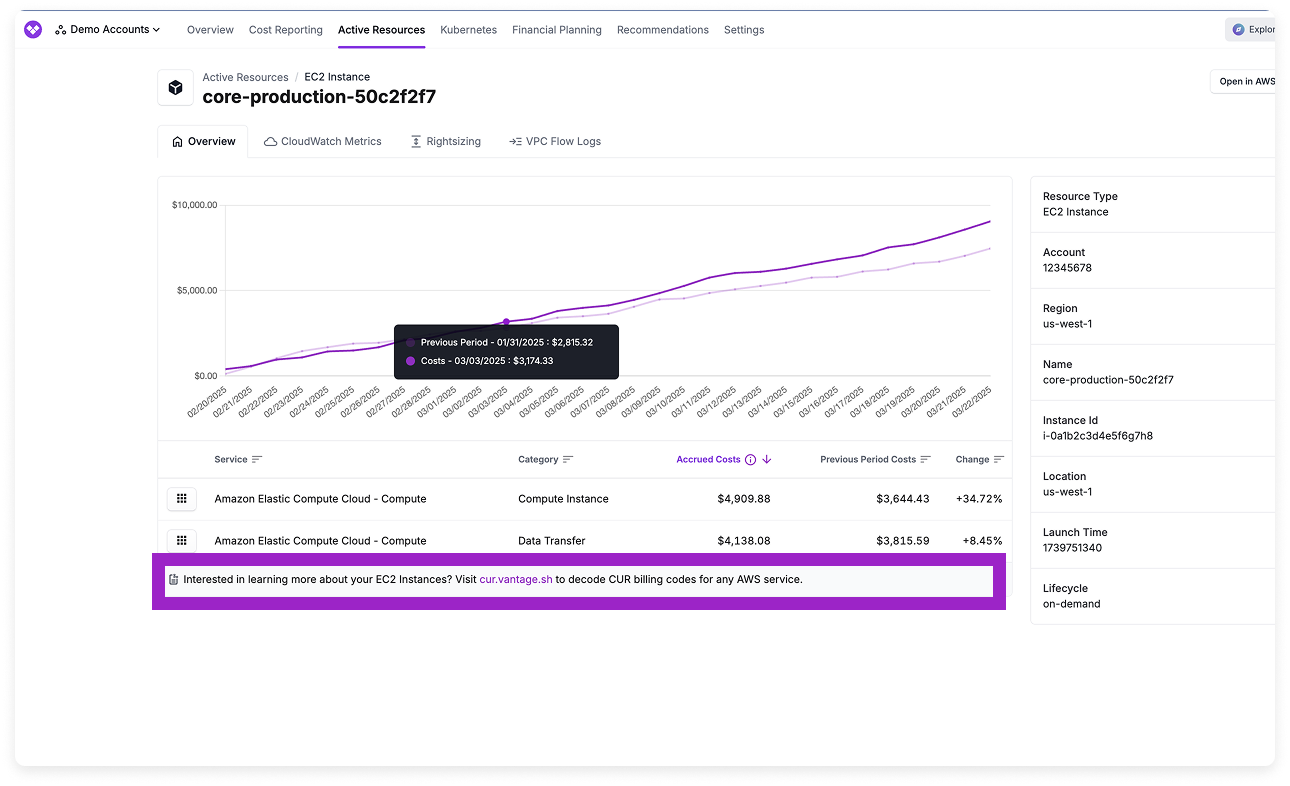
AWS practitioners who are having trouble understanding AWS billing codes can find descriptions of each billing code, other variations of that billing code, and other services that use the same billing code for specific services in Resource Reports. When you view a Resource Report for a specific service (e.g., EC2 instances), a link to cur.vantage.sh is provided that takes you to a page with details for that billing line item.cur.vantage.sh is a free utility that gives cloud practitioners simple definitions of billing codes for every AWS service. The site has a distinct page for each AWS service (e.g., S3 or EC2) that clusters together similar billing codes for that service, as there may be separate or distinct billing codes for each individual region.
Resource Relationships
You can view relationships between specific resources on the Relationships tab.
| Resource | Relationship |
|---|---|
| Amazon EBS Volumes | See associated EC2 instances, with accrued cost, account, instance ID, region, instance type, launch time, and lifecycle |
| Amazon EC2 Instances | See associated EBS volumes and IP addresses, with accrued cost, account, volume type, size, IOPs, and state |
| Amazon IP Addresses | See associated EC2 instances, with accrued cost, account, instance ID, region, instance type, launch time, and lifecycle |
| Amazon RDS Snapshots | See associated RDS instances, with accrued cost, account, database identifier, engine, engine version, instance type, status, and allocated storage |
| Azure Disks | See associated Azure Virtual Machines with accrued cost, account, resource ID, admin username, virtual machine size, boot diagnostics enabled, secure boot enabled, date/time created |
| Azure Virtual Machines | See associated disk resources with accrued cost, account, resource ID, disk size, OS type, disk IOPs read/write, disk state, encryption type, network access policy, provisioning state, public network access, zones, and date/time created |
| GCP Compute Disks | See associated Compute Instances, with accrued cost, account, instance name, machine type, creation timestamp, CPU platform, and resource URL |
| GCP Compute Instances | See associated Compute Disks, with accrued cost, account, disk name, disk type, size, architecture, creation timestamp, and resource URL |
The Relationships tab only appears when related resources are found. If a resource has no associated relationships, the tab will not be displayed.
S3 Storage Summary
For S3 buckets, a Storage Summary tab is available that provides a list of storage classes, their corresponding storage sizes, and approximate monthly costs for objects in the S3 bucket.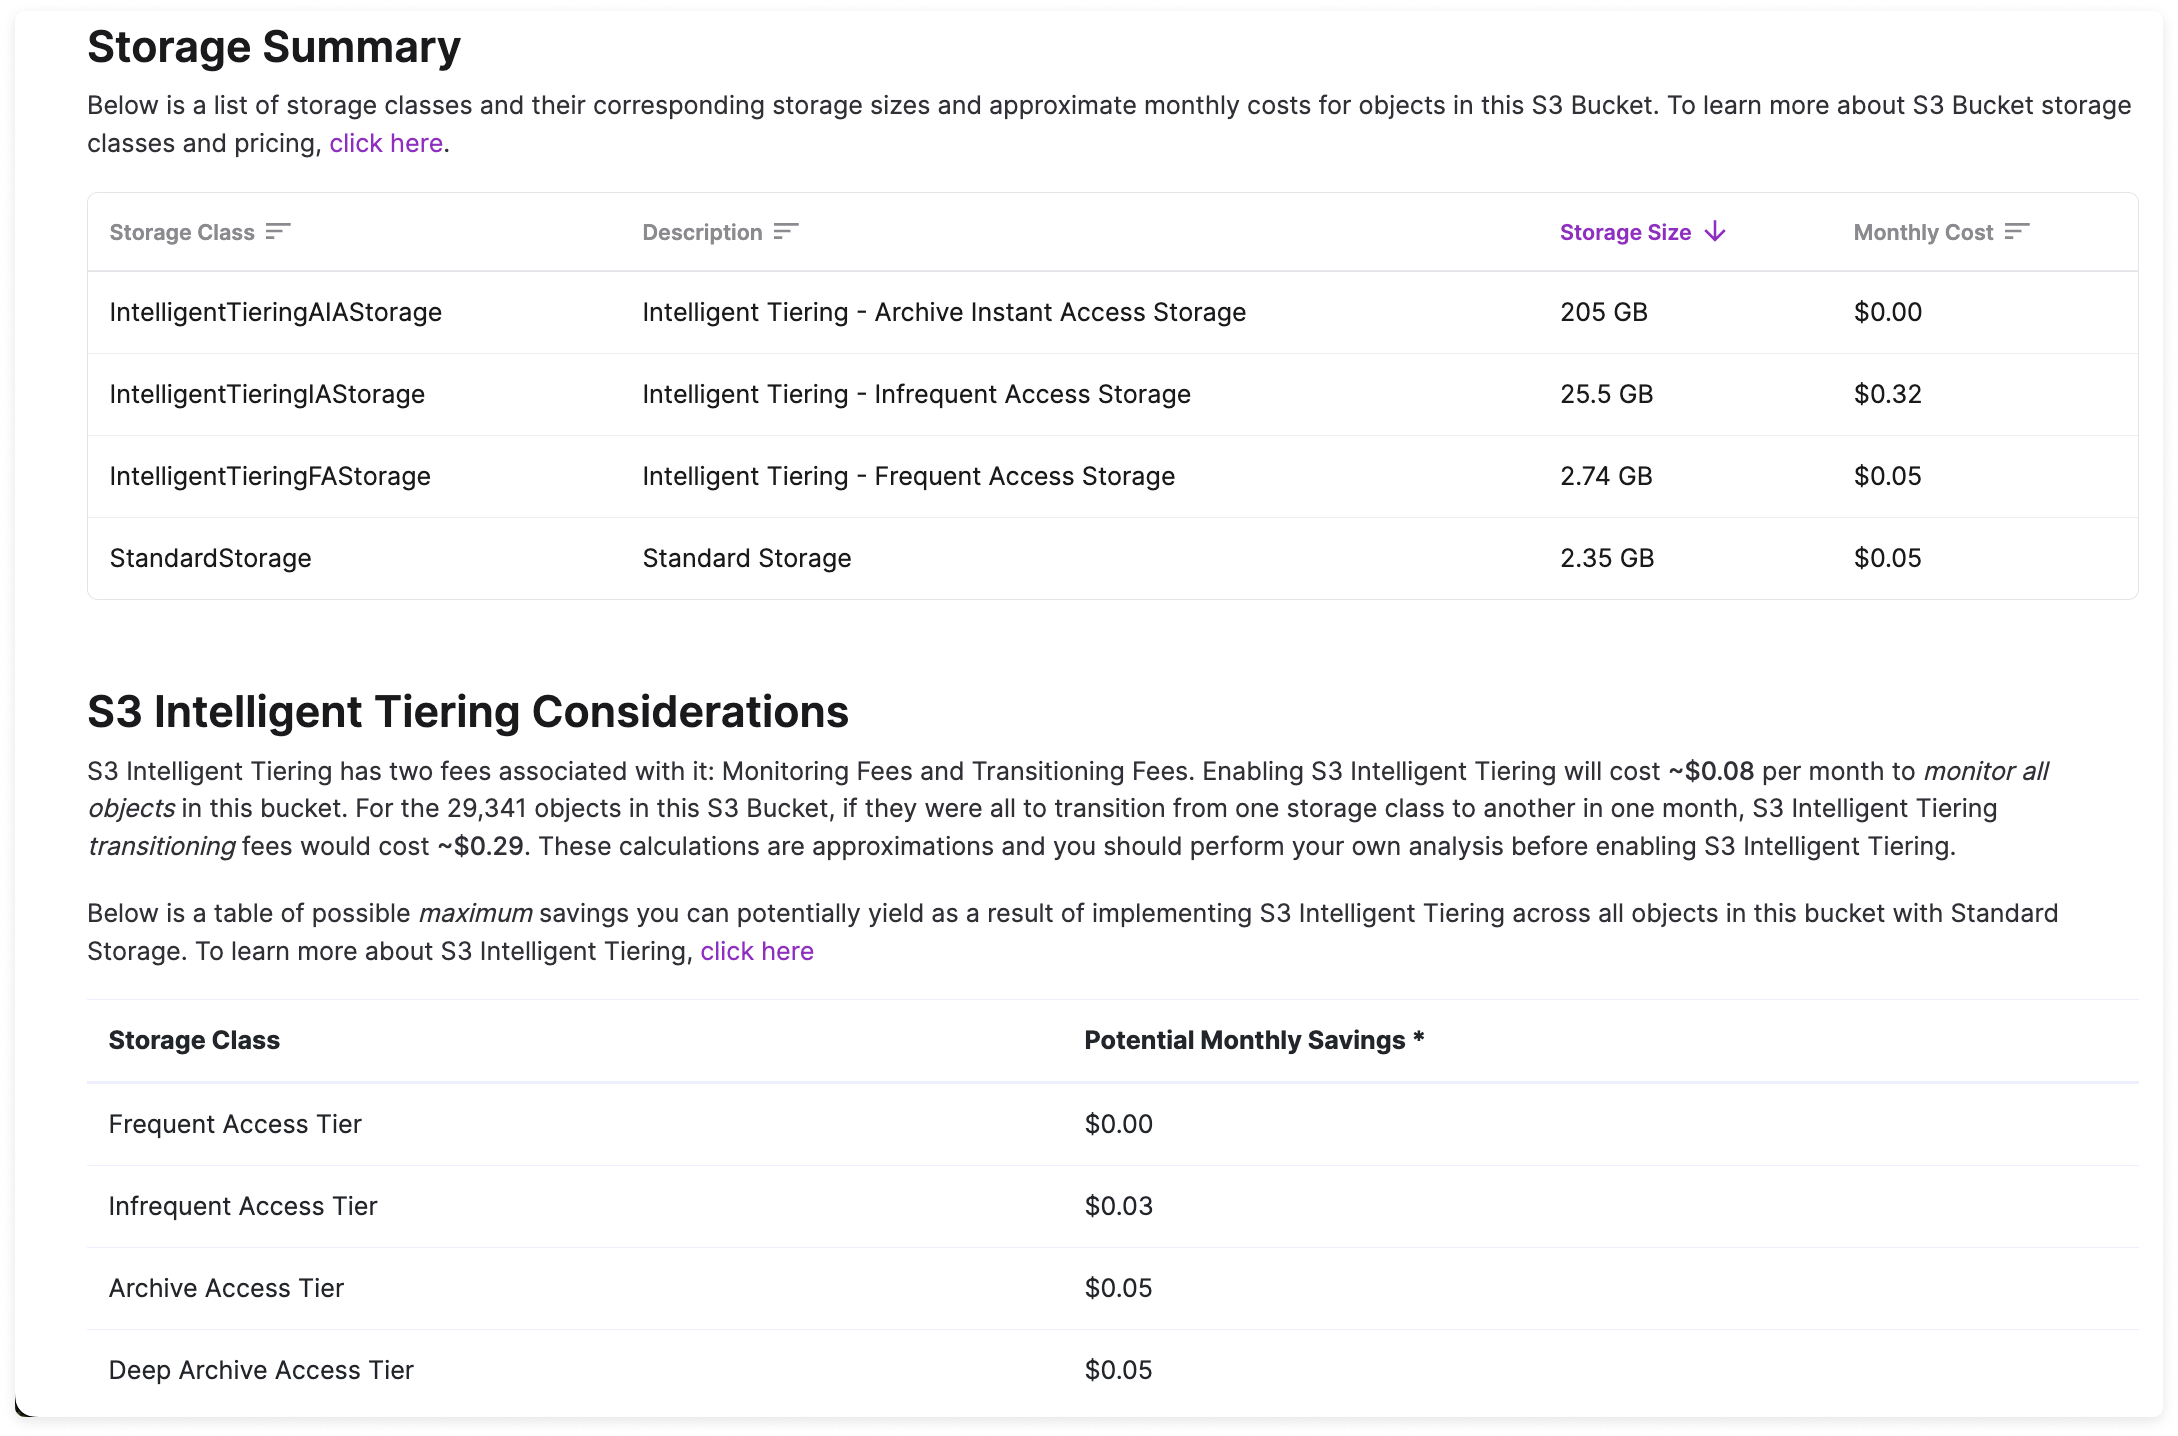
S3 Request Metrics and Egress
To view S3 request metrics and egress data, you must configure request metrics on the S3 bucket. It takes roughly 15 minutes for AWS to begin delivering these metrics after they are enabled. See the AWS documentation for more information about ingress and egress request metrics.The required
s3:GetMetricsConfiguration and s3:ListBucketMetricsConfigurations permissions are included automatically via the VantageS3RequestMetrics policy in the default CloudFormation template and StackSet.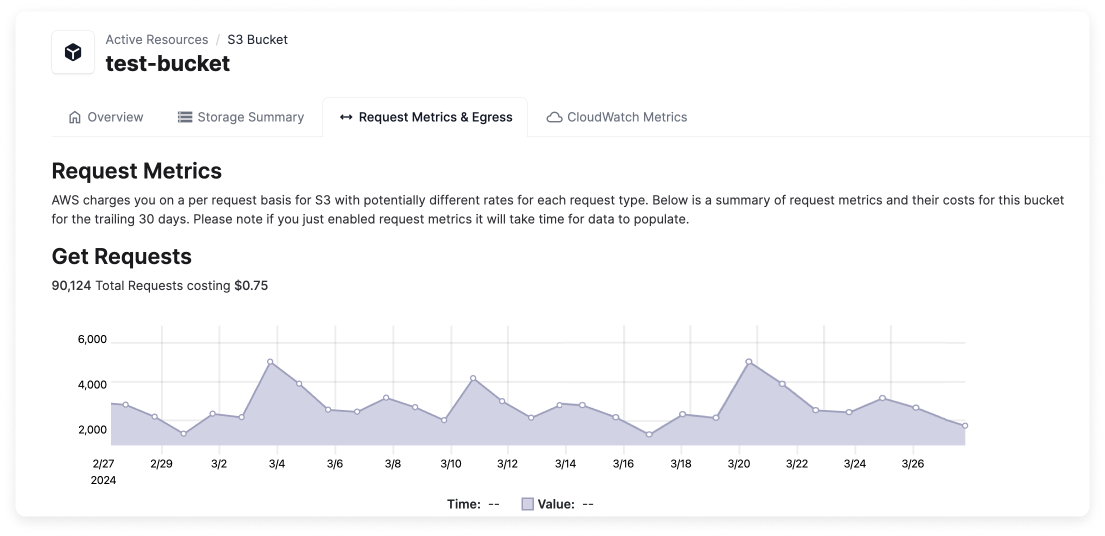
GET, PUT, HEAD, POST, SELECT, and LIST) is provided, which visualizes the total number of requests. The total cost for each request type is also provided.
EC2 Rightsizing Recommendations
For EC2 instances where Vantage identifies rightsizing opportunities, the Rightsizing tab is displayed with recommendations. See the Cost Recommendations documentation for details.CloudWatch Metrics
For certain resources, you can view high-fidelity charts for CloudWatch metrics. On resources that support CloudWatch metrics, the CloudWatch Metrics tab is displayed. These metrics are useful for rightsizing servers and databases based on utilization.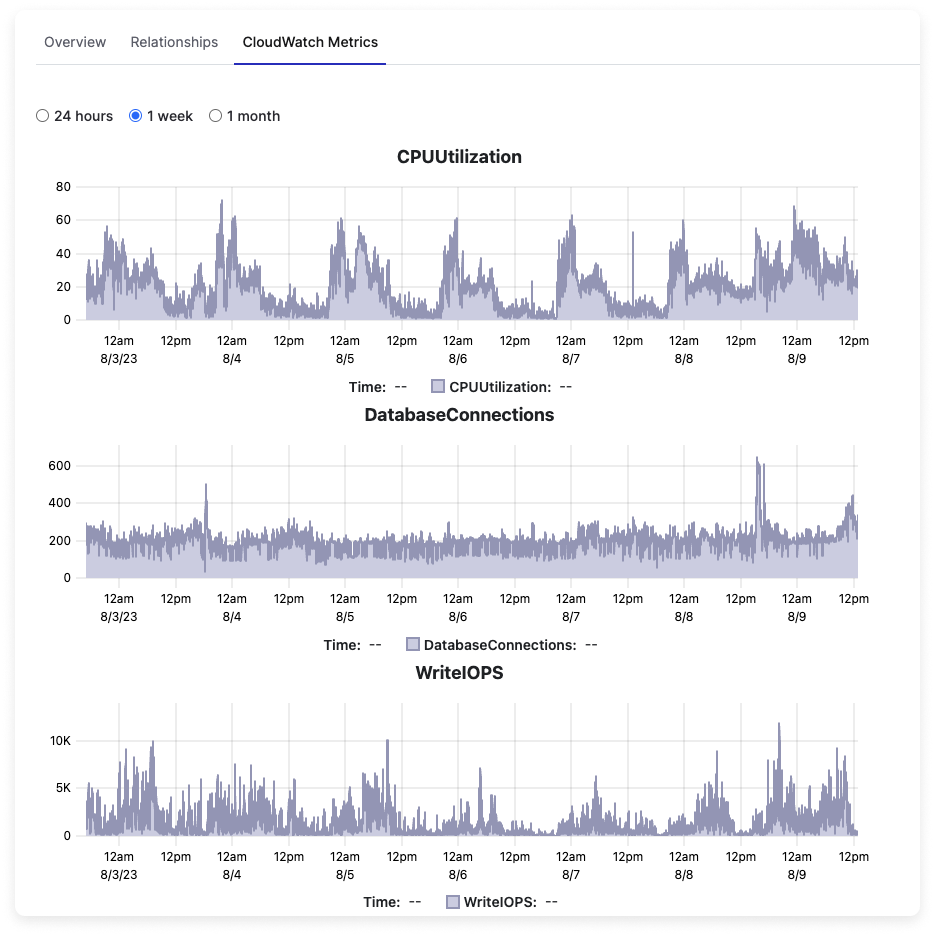
| Service | Metrics |
|---|---|
| EC2 | CPU Utilization, Network In, Network Out, Memory Utilization* |
| EBS | Read Bytes, Write Bytes, Queue Length |
| RDS | CPU Utilization, Database Connections, Free Storage Space, Write IOPS, Read IOPS |
| S3 | Bucket Size Bytes, Number of Objects |
| ECS/Fargate | CPU Utilization, Memory Utilization |
VPC Flow Logs
For active resources that generate network traffic costs, such as NAT Gateways and EC2 instances, the VPC Flow Logs tab is displayed. Select this tab to view peer resources and the associated traffic category (e.g., public). A Sankey diagram of each associated network flow is provided. See the Network Flow Reports documentation for details on network flow reporting.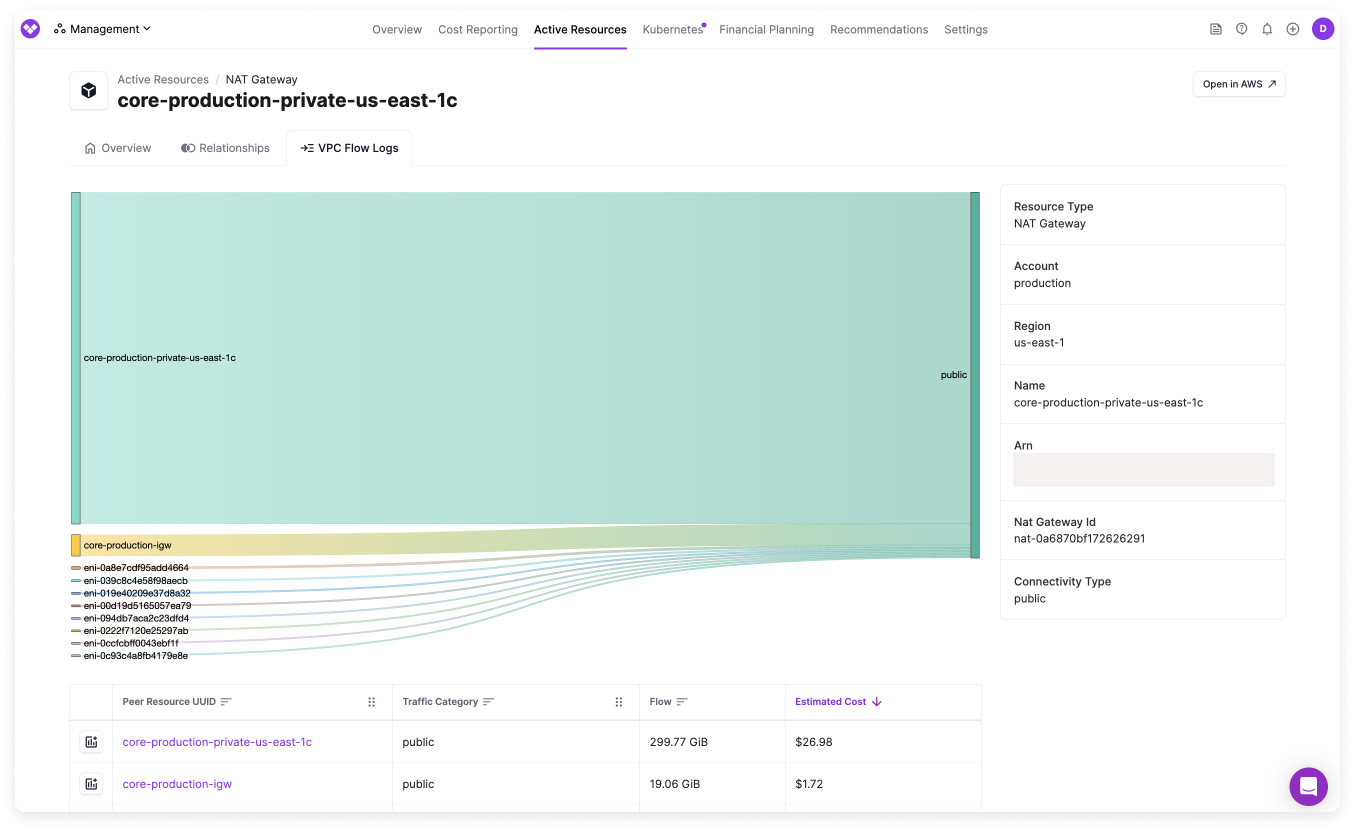
Extended Support Recommendations
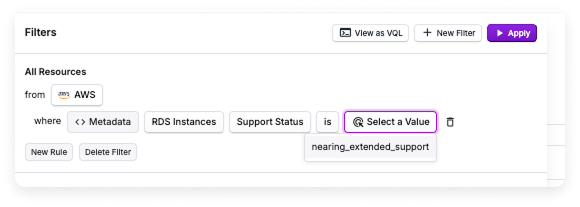
Vantage surfaces metadata and recommendations for AWS services that enter Extended Support to help teams understand upcoming end-of-support milestones and plan upgrades. This information is currently available for EKS, ElastiCache, OpenSearch/Elasticsearch, and RDS. When you view EKS, ElastiCache, OpenSearch, or RDS Resource Reports, additional metadata fields for Support Type (Standard or Extended), Standard Support End Date, and Extended Support End Date are available. From any Resource Report, add a new filter:- Standard Support End Date:
from AWS where Metadata <Resource Type> Standard Support End Date is <DATE> - Support Status:
from AWS where Metadata <Resource Type> Support Status is <VALUE e.g., nearing_extended_support>
EKS Extended Support
Select a cluster from the Resource Report list, then select the Extended Support tab. On this tab, Vantage provides a list of versions with their standard and extended support dates, displayed in descending order (newest first), as well as the current version of the cluster. Recommendations for the version to upgrade to are also provided. Vantage only recommends versions that have at least 90 days of standard support remaining, ensuring you won’t be recommended a version that’s about to enter extended support.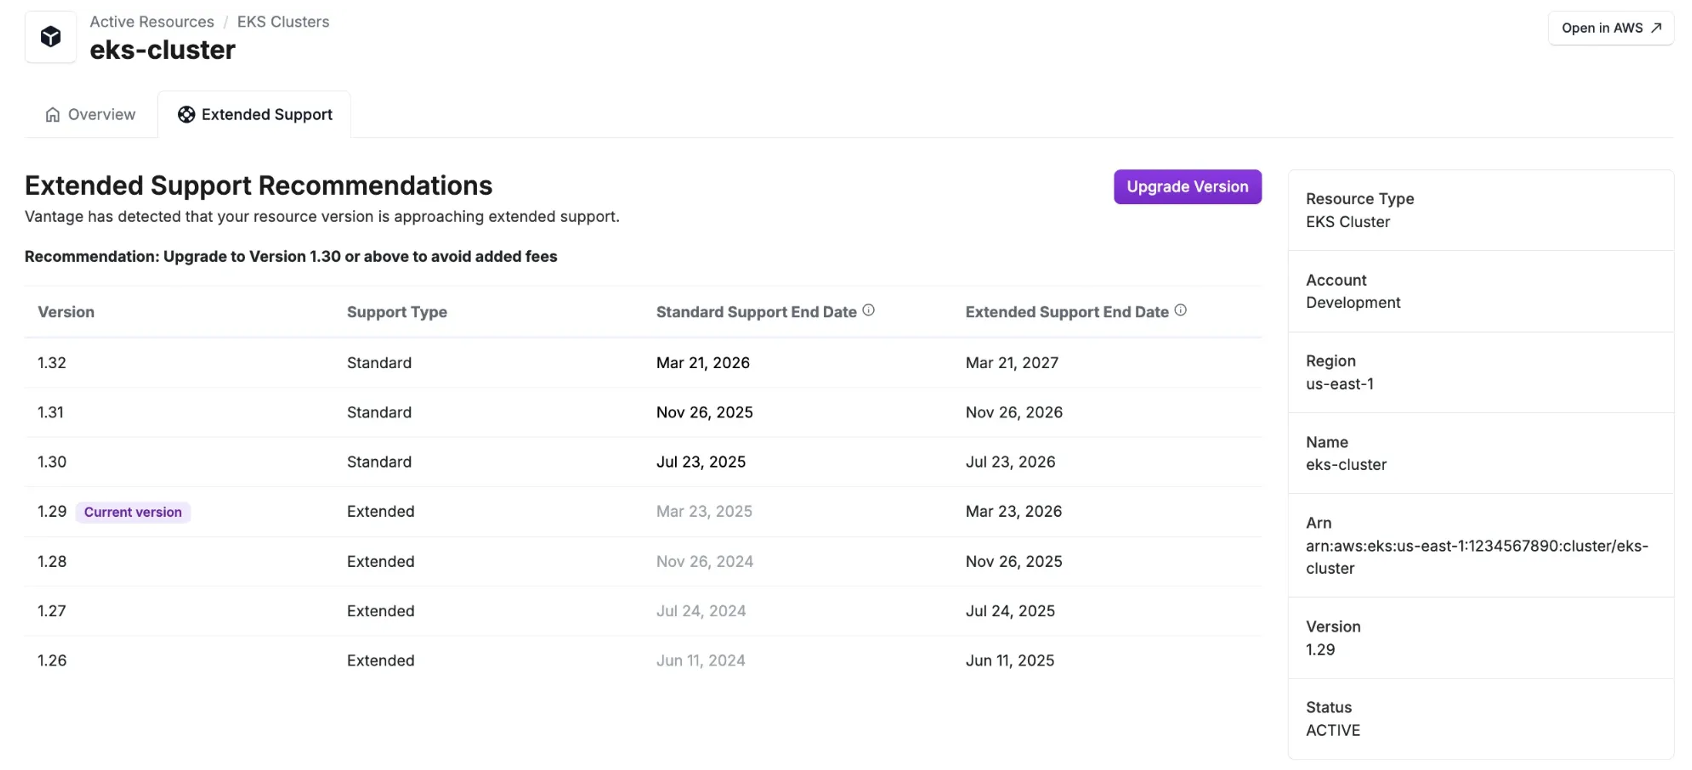
ElastiCache Extended Support
Vantage automatically identifies Amazon ElastiCache for Redis clusters that are in, or approaching, Extended Support. This includes Redis OSS versions with published AWS Extended Support timelines, beginning with Redis OSS v4 and v5. For each ElastiCache for Redis cluster monitored in Vantage, the following process is used to estimate projected Extended Support costs:
Select a cluster from the Resource Report list, then select the Extended Support tab. On this tab, Vantage provides upgrade recommendations, including the version required to exit Extended Support. The primary recommendation is to move to ElastiCache for Valkey or to a newer Redis OSS version supported by AWS. Vantage determines the next version number that does not have an Extended Support date within the next three months; however, it is recommended you upgrade to the highest allowable version based on your application’s dependencies.
Click Upgrade to go to the AWS Management Console and perform the upgrade.
OpenSearch/Elasticsearch Extended Support
Vantage automatically identifies Amazon OpenSearch Service domains that are in, or approaching, Extended Support. This includes both legacy Elasticsearch versions and OpenSearch versions with published Standard Support and Extended Support timelines. For each OpenSearch Service domain monitored in Vantage, the following process is used to estimate projected Extended Support costs:
Select a domain from the Resource Report list, then select the Extended Support tab. On this tab, Vantage provides upgrade recommendations, including the version required to exit Extended Support. Vantage determines the next version that does not have an Extended Support date within the next three months; however, it is recommended you upgrade to the highest allowable version based on your application’s dependencies.
Click Upgrade to go to the AWS Management Console and perform the upgrade.
RDS Extended Support
Vantage automatically identifies Amazon RDS instances that are in, or approaching, Extended Support for MySQL and PostgreSQL. For each Amazon RDS MySQL or PostgreSQL instance monitored in Vantage, the following process is used to estimate projected Extended Support costs:Check if the instance is within three months of this date.
- If yes, proceed with cost estimation.
- If auto-upgrade is enabled for MySQL or PostgreSQL, the instance is excluded.
GCP Compute Rightsizing Recommendations
For GCP Compute resources where Vantage identifies rightsizing opportunities, the Rightsizing tab is displayed with recommendations. See the Cost Recommendations documentation for details.Kubernetes Rightsizing Recommendations
For Kubernetes workloads where Vantage identifies rightsizing opportunities, the Rightsizing tab is displayed with recommendations. See the Cost Recommendations documentation for details on how to view and use this information.Datadog Host Costs
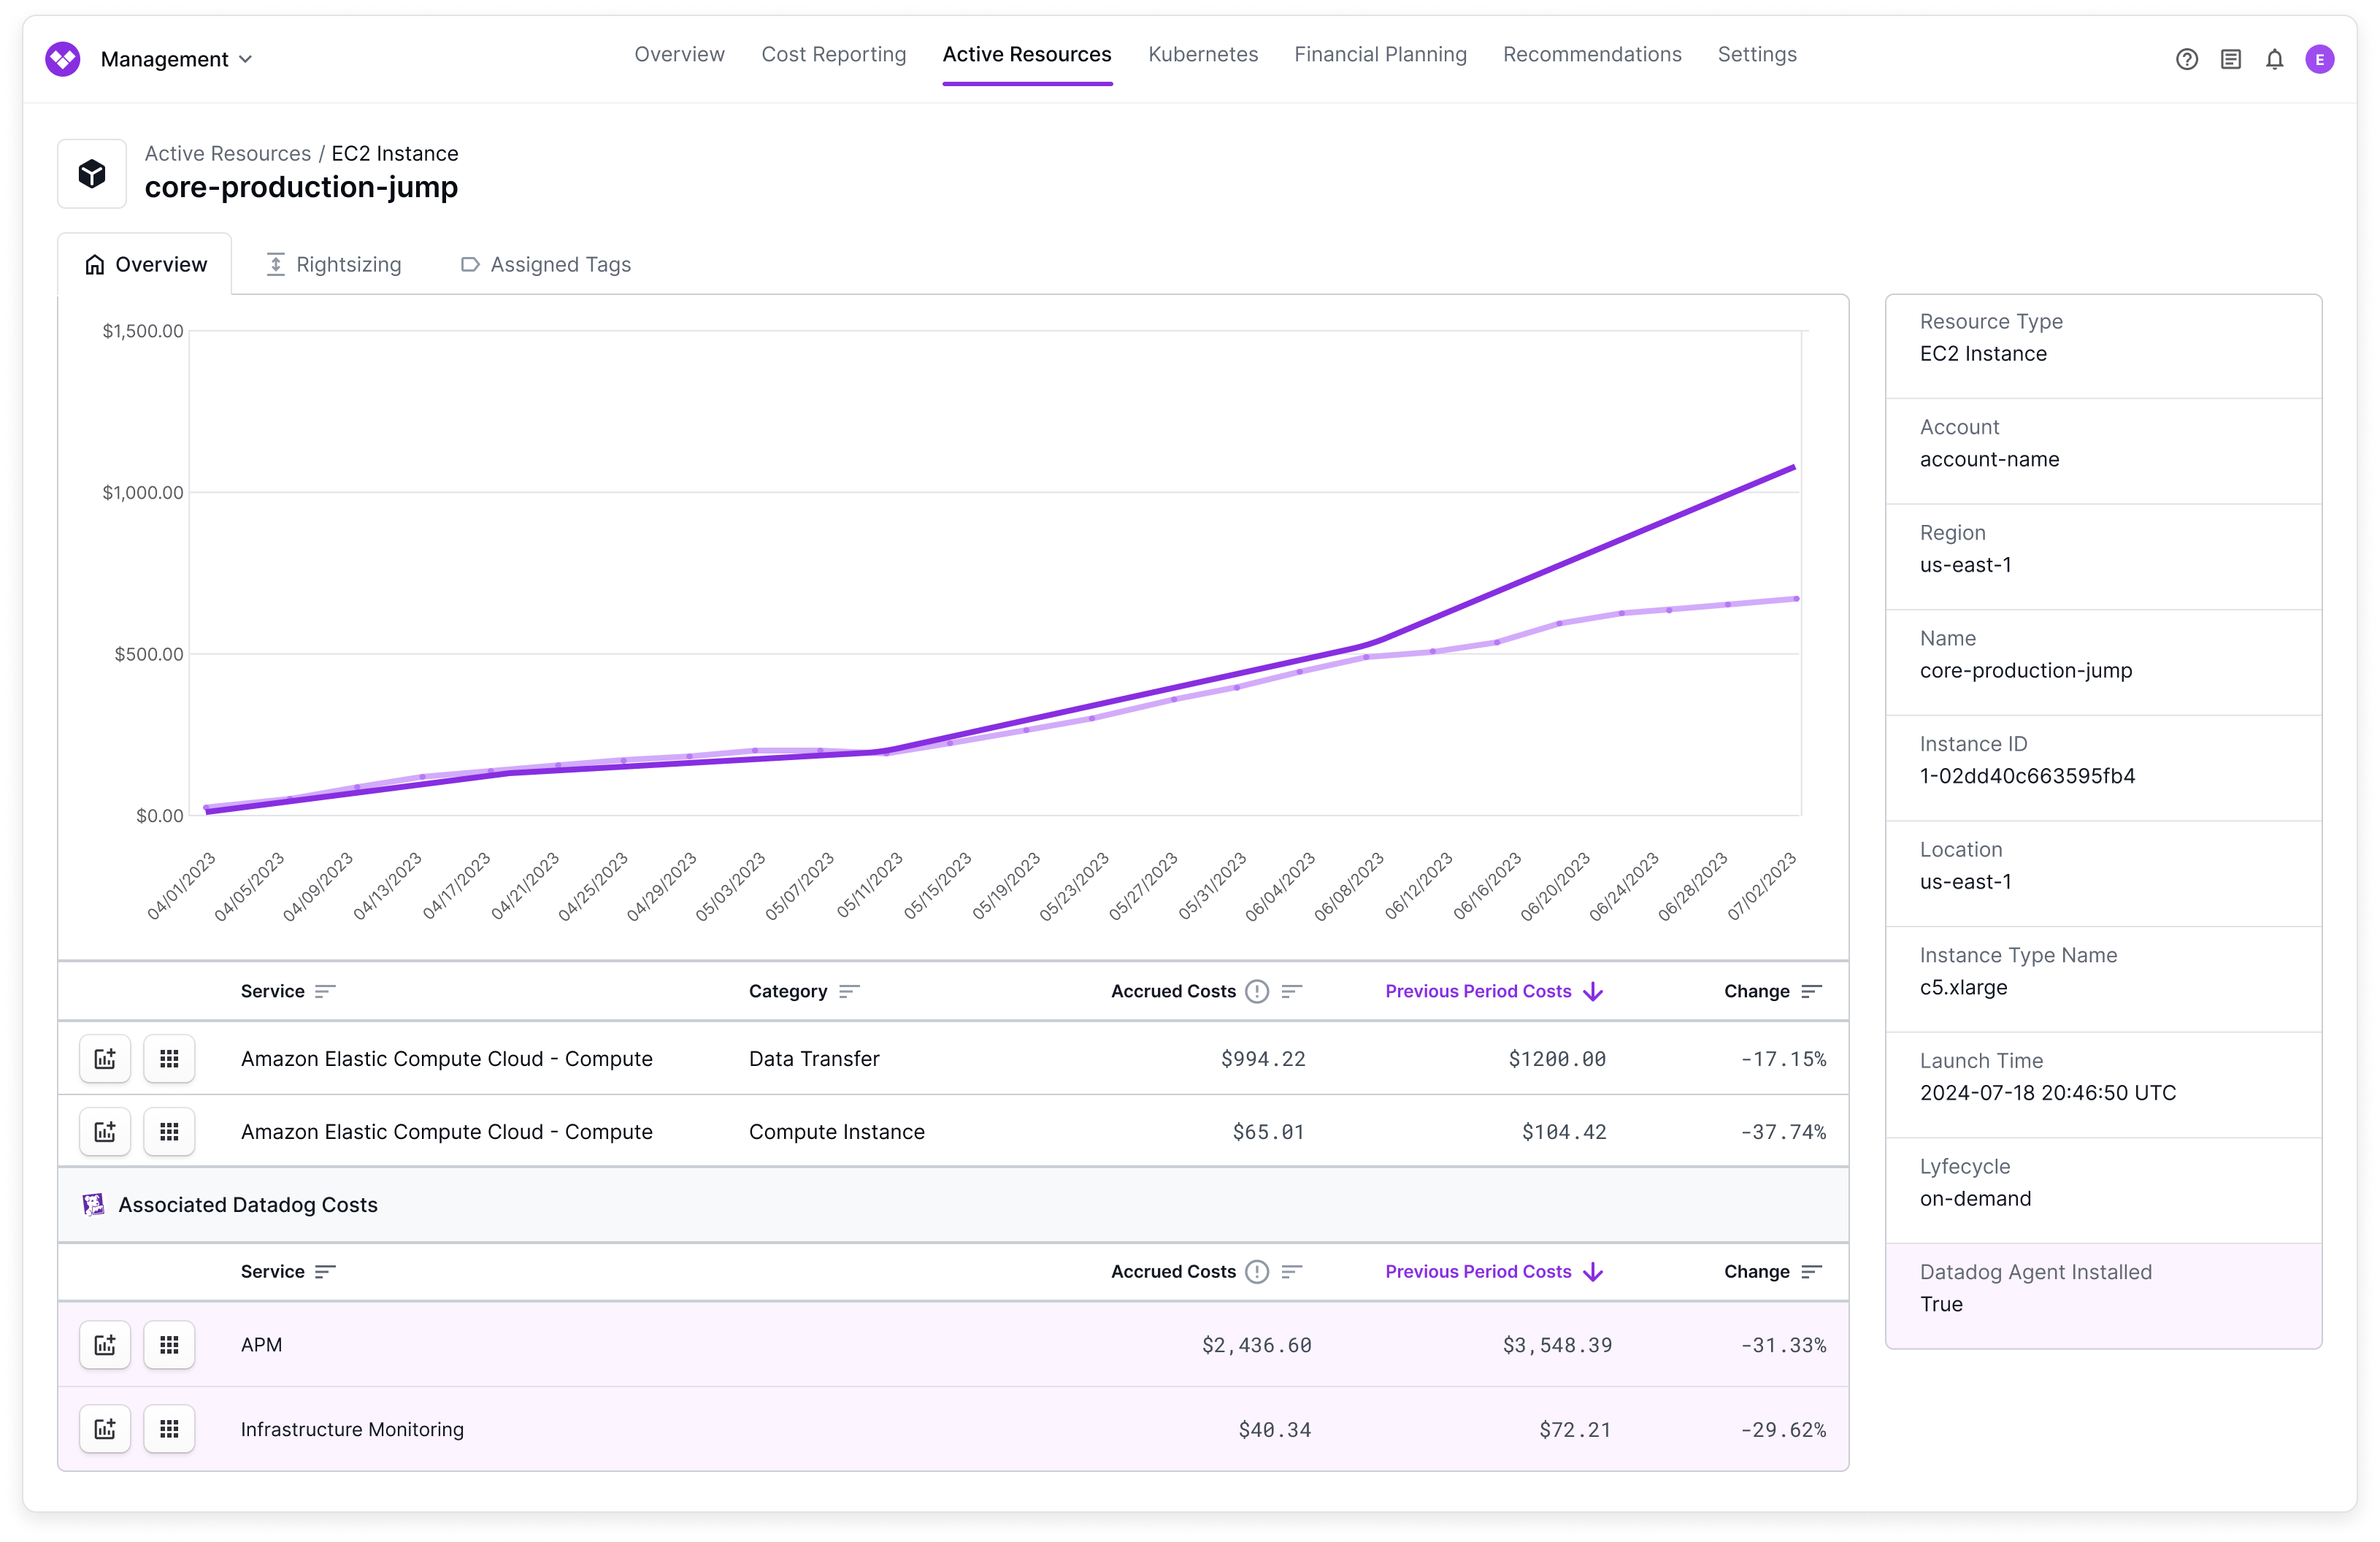
For cloud resources that have the Datadog agent installed, Vantage can associate Datadog per-host fees along with the primary cloud resources from AWS, Azure, and Google Cloud that drive those costs.
On Active Resource views for resources like EC2 instances or Virtual Machines, the Associated Datadog Costs section is displayed and provides a service breakdown of costs.
The following resources are supported:
- Compute resources with the Datadog agent installed, such as virtual machines or container services
- Databases that are monitored by Datadog’s DBM
- Infrastructure Monitoring
- Database Monitoring
- APM (Hosts)

Datadog Custom Metrics
For Datadog accounts with custom metrics, Vantage can surface unused custom metrics that are no longer providing value. Vantage identifies custom metrics that are unused by checking if:- The metric has not been queried in the past 30 days
- The metric is not referenced by any dashboards, monitors, notebooks, or SLOs
- Metric Name: The name of the custom metric
- Unit: The unit of measurement for the metric
- Per Unit: The per-unit cost for the metric
- Description: Description of the metric
- Short Name: Short name for the metric
- Statsd Interval: The StatsD interval for the metric
- Integration: The integration that created the metric
- Tags: Tags associated with the metric
- Indexed Volume: The indexed volume for the metric
- Has Related Assets: Whether the metric is related to any dashboards, monitors, notebooks, or SLOs
- Has Been Queried: Whether the metric has been queried in the last 30 days


