At this time, only AWS is supported. Additional support for providers with flow log functionality, such as Azure and Google Cloud, is planned for the future.
Set Up VPC Flow Log Integration
Network Flow Reports require an existing AWS provider integration. The Vantage AWS account-specific IAM role needs to be granted access to the S3 buckets where you publish your VPC Flow Logs. Vantage can automatically detect any existing S3 buckets that contain VPC Flow Logs. You need to configure this integration for each AWS account that has an S3 bucket with VPC Flow Logs.The Vantage configuration does not work with Amazon CloudWatch because of the high cost of querying CloudWatch. Logs need to be published to S3 for the Vantage integration to work.
Prerequisites
Ensure you have at least the following fields in your VPC Flow Log format to increase the discoverability of network-related costs. If you do not have these fields enabled, Vantage may be unable to properly correlate your network flows to estimated costs.Cost to Enable VPC Flow Logs in AWS
When you enable VPC Flow Logs, you incur both S3 storage costs and CloudWatch data ingestion costs on your AWS bill. These charges are represented in the costs for the S3 bucket where your flow logs are written to as well as anS3-Egress fee from CloudWatch. Unfortunately, there is no way around these costs being incurred. Vantage has contacted various AWS platform teams to attempt to remove this cost, but this is likely a limitation that AWS is unwilling to change or remove.
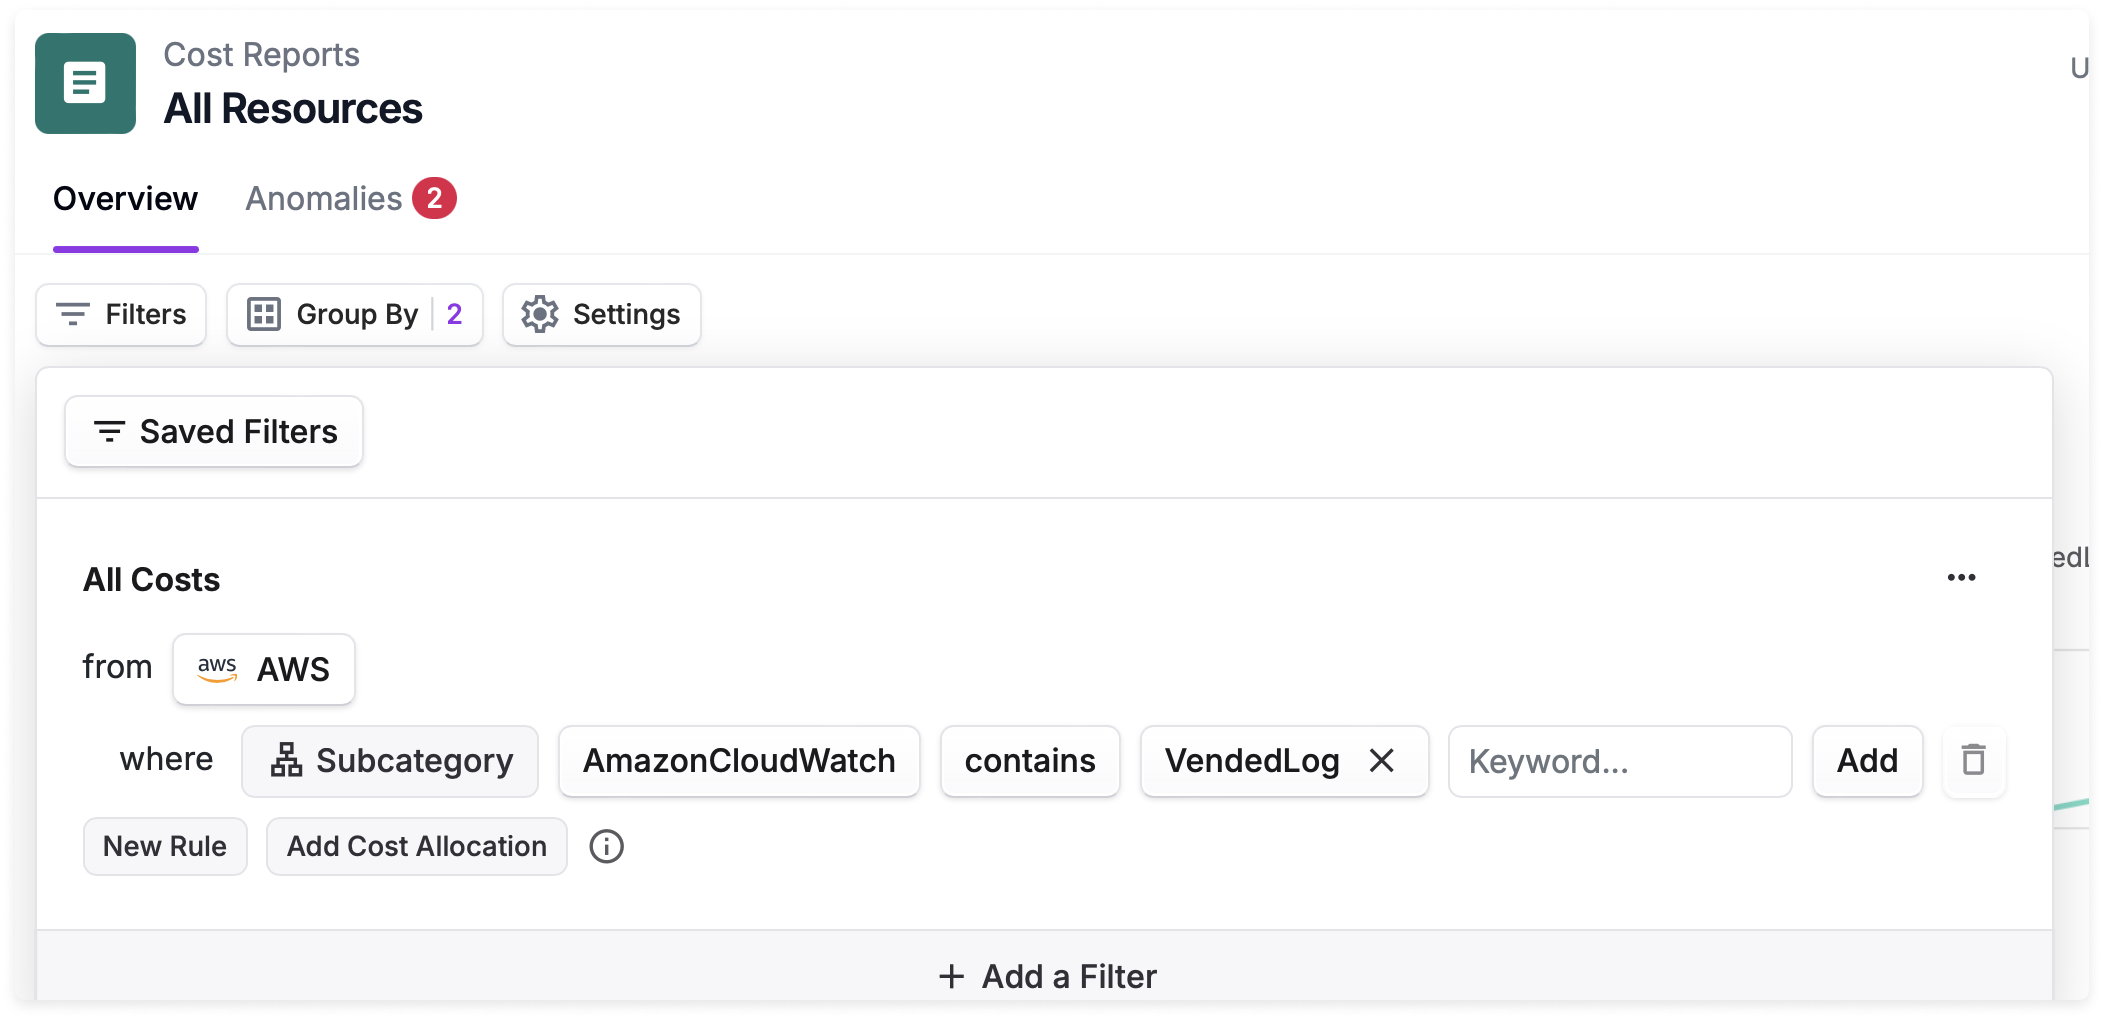
These logs are considered Vended Logs. You can create a Cost Report that monitors these charges:
- Set Provider to AWS.
- Set Subcategory to AmazonCloudWatch contains VendedLog.
For more information about VPC Flow Logs pricing, see this Cloud Cost Handbook article.
Enable the Integration
Click Configure VPC Flow Logs.
See the Troubleshooting section if you are running into issues with seeing some of your flow logs on the onboarding workflow.
All flow logs that have been synced as active resources in Vantage are displayed in the left panel of the onboarding workflow. Click the checkbox next to any listed flow log to select all log files. You can also click the down arrow to the right of any flow log and select or deselect specific log files listed.
When you select the checkbox, the Sync All toggle is automatically enabled. You can disable this option if you do not want the files to automatically sync again each night.
The right panel contains instructions on how to get set up using the AWS CLI, AWS Management Console, or the Vantage Terraform provider. Select the tab for your preferred option. If you have multiple connected accounts with VPC Flow Logs, instructions or code samples are provided for each account.
After you run the code in the AWS CLI, deploy your Terraform configuration, or complete the steps in the AWS Management Console, click Check Permissions. A message is displayed that indicates whether the bucket permissions were successfully set up or if they are missing. A red X is displayed next to any buckets in the left panel that do not have sufficient permissions. Some log files may also be unsupported. See the section below for details.
Unsupported Logs
When a particular log cannot be imported, Vantage displays a status label next to the log name in the Manage VPC Flow Logs window. Hover your mouse over the label to see additional information about the issue.| Issue | Description |
|---|---|
UNSUPPORTED TRAFFIC | Vantage does not import any REJECT flows, nor any flows that do not generate corresponding costs. |
UNSUPPORTED DESTINATION | This message is displayed if a log is going to any destination other than S3. Logs need to be published to S3 to be imported by Vantage. |
UNSUPPORTED LOG FORMAT | Unsupported log format means that your log may be missing some required columns. Hover over the UNSUPPORTED LOG FORMAT label to see a list of missing columns. Ensure your logs contain the columns noted in the Prerequisites section. |
UNSUPPORTED RESOURCE | The flow log is configured against a resource type that Vantage does not currently process for VPC Flow Log Reports. |
BUCKET NOT FOUND | Vantage cannot locate the destination S3 bucket for this flow log. Verify the bucket still exists and that Vantage has read access to it. |
DELIVERY ERROR | AWS reported an error delivering flow logs to the destination bucket. Check the flow log’s delivery status in the AWS console for details. |
DELIVERY PENDING | AWS has accepted the flow log configuration but has not yet started delivering data. This status typically clears within a few hours. |
Troubleshooting
When you click Check Permissions during the onboarding process, an error is displayed when the correct permissions are not set up. Ensure that you add the correct permissions displayed in the onboarding workflow for each account.KMS Encrypted Buckets
An error is displayed for buckets that are encrypted with AWS Key Management Service (KMS). You will need to either remove encryption on these buckets or provide Vantage the necessary permissions to decrypt (i.e.,kms:Decrypt).
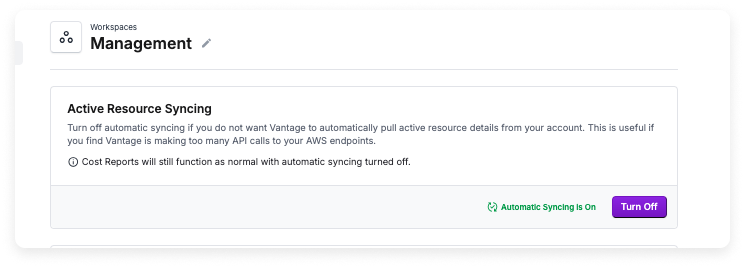
No Logs Displayed
You may see a message indicating No VPC flow logs with log destination found. If you have recently created these resources it may take up to 24 hours for Vantage to sync the metadata. Wait at least 24 hours if you recently created new resources. This can also be an issue if you have not enabled active resource syncing. To enable syncing:Navigate to the Workspaces section of the console.
Manage Existing Integrations
After your integration is set up, you can view and manage your connected VPC Flow Logs directly from the AWS Settings page:On the VPC Flow Logs tab, the Manage Connected VPC Flow Logs panel lists each S3 bucket destination, the AWS account it belongs to, the current import status, and the connection date. Click any row to view the import history for that integration (including each VPC flow log’s status, date, ingestion time, and row count), or click the trash icon to remove a bucket from syncing.
If you add additional fields to your VPC Flow Log format in AWS, and you already sync these logs to Vantage, this new data will be imported to Vantage on the next nightly import.
Create a New Network Flow Report
Follow the steps below to create a new Network Flow Report:From the side navigation, click Network Flow Reports. All your existing Network Flow Reports are displayed, along with who created the report and the date it was created.
A new Network Flow Report is displayed.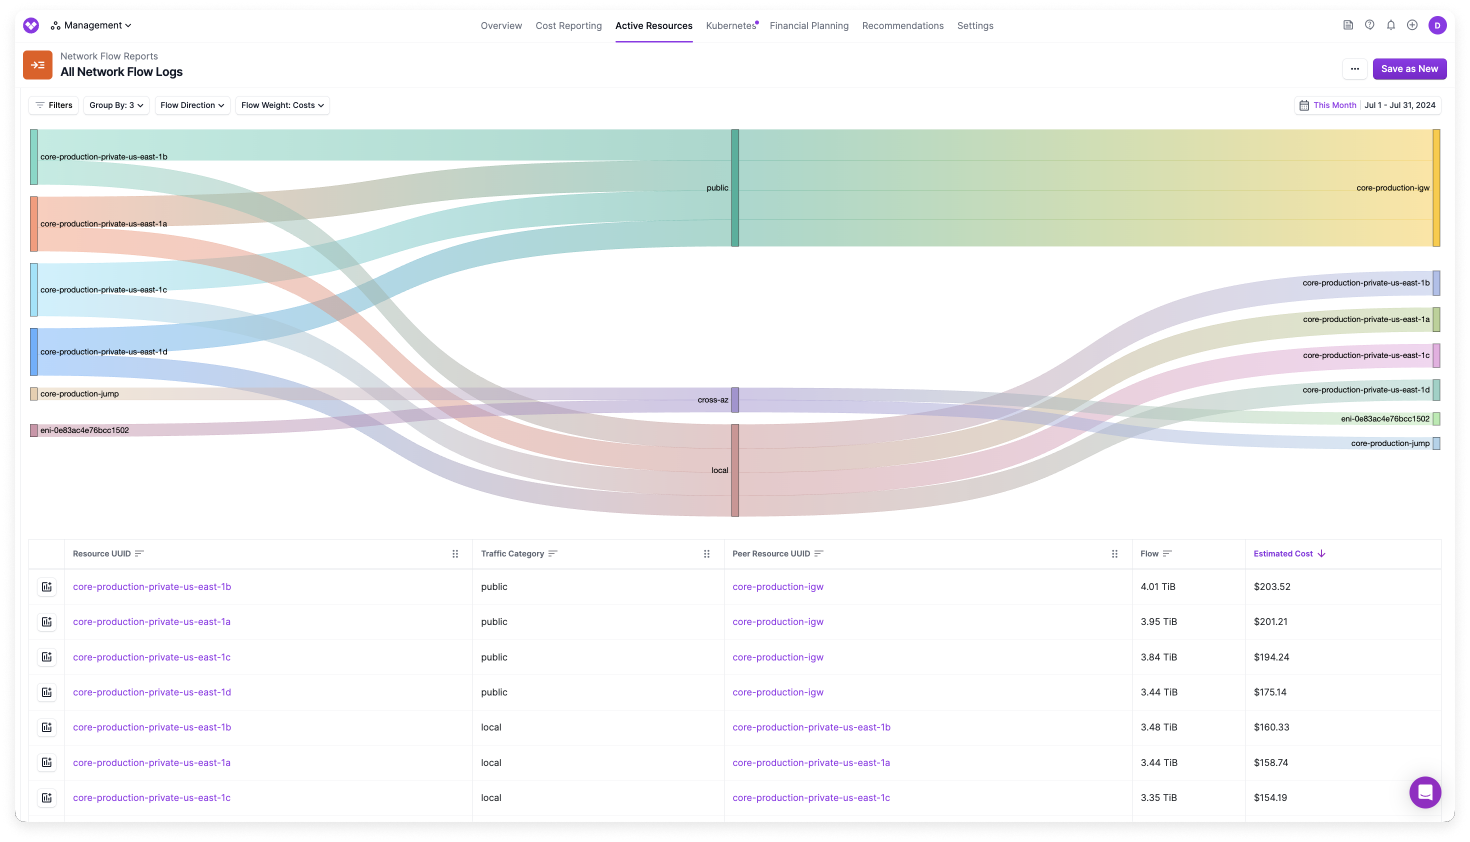
- At the top of the report, a Sankey diagram is provided. This diagram shows different network flows, based on your selected filters and grouping criteria. For example, in the image below, the nodes on the left side of the diagram show the sources of network traffic. Links, or network flows, flow from the nodes to their traffic destination (in this example, cross-AZ or public). The width of each flow corresponds with the volume of traffic or estimated cost, based on your settings, and the color corresponds with the source of the node (e.g., yellow for public in the example below).
- In the table below the diagram, the network flow information is displayed along with the volume of traffic (in bytes). The table is sorted in descending order by the Estimated Cost column. Click any column header to change the sort order. Each flow shows the estimated cost associated with that specific traffic route, helping you identify the most expensive data transfers. (See the section below for details on how the Estimated Cost column is calculated.)
- For each listed resource, a link to the Active Resources screen is provided. Click this link to view additional metadata about the resource. From the Active Resources screen, click the Relationships tab to view any associated resources, such as a corresponding IGW for a VPC resource.
You can update the criteria displayed in the Sankey diagram with the following options:
- By default, both egress and ingress traffic are displayed. Expand the Flow Direction menu above the diagram to change the flow to only Egress or Ingress.
This filter depends on whether
flow_direction is present in your VPC Flow Log format. If flow_direction is not present in your VPC Flow Log format, then a No data available in table message is displayed on the report. See the Prerequisites section for the recommended VPC Flow Log format. To add the field to your format, create a new VPC Flow Log configuration that includes the flow_direction field.By default, Vantage ingests network flows into your account daily and keeps the data available for one week. For Enterprise customers, this retention period can be adjusted. Contact support@vantage.sh if you need a longer retention period.
- You can move the columns in the table at the bottom to visualize different flows. The diagram is also updated to depict the new order in the table.
Click to view example image
Click to view example image
- You can also filter and group/add more columns to the report. See the next section for details.
Filter and Group a Network Flow Report
By default, a Network Flow Report is grouped by the following fields:- Source Resource UUID
- Peer Resource UUID
- Traffic Category
Click to view all fields
Click to view all fields
| Vantage Field | Description | Example |
|---|---|---|
| Account ID | AWS account ID of the source network | production, 123456789012 |
| Availability Zone ID | ID of the source Availability Zone | us-east-1a |
| Destination Address | Specific IP address that identifies the location of where the traffic is being sent | An IP, like 1.23.456.90 |
| Destination Hostname | Domain name that corresponds with the IP address of the destination (see note below table) | 01234.broadband.com OR Datadog A dsthostname:null value means Vantage is unable to reverse DNS the dst_address IP address. |
| Flow Direction | Movement of network traffic relative to a specific network interface | Ingress or egress |
| Interface ID | Source ENI ID | eni-001d78b2agh4caa05 |
| Instance ID | Source instance ID | i-0b22a22eec53b9321 |
| Peer Resource UUID | Destination resource name, ARN, or tag (if available). When a Name tag exists, the human-readable name is displayed instead of the raw ARN. | my-instance OR eni-c123ab7f9c55af9a6d OR example-tag |
| Peer Account ID | Destination account ID | production, 123456789012 |
| Peer VPC ID | Destination VPC ID | vpc-12a34567b8g8a03ef |
| Peer Region ID | AWS Region of destination | us-west-2 |
| Peer Availability Zone ID | ID of the Availability Zone for the destination | us-east-1b |
| Peer Subnet ID | Destination subnet ID | subnet-123ab7f9c55af9a6d |
| Peer Interface ID | Destination ENI ID | eni-001d78b2agh4caa12 |
| Peer Instance ID | Destination instance ID | i-0b22a22eec53b9321 |
| Region | AWS Region of the source | us-east-1 |
| Resource UUID | Source resource name, ARN, or tag (if available). When a Name tag exists, the human-readable name is displayed instead of the raw ARN. | my-instance OR eni-c123ab7f9c55af9a6d OR example-tag |
| Source Address | Specific IP address from which the network traffic originates | An IP, like 1.23.456.90 |
| Source Hostname | Domain name that corresponds with the IP address of the source (see note below table) | 100.123.456.789.bc.googleusercontent.com OR Datadog |
| Subnet ID | ID of the source subnet | subnet-123ab7f9c55af9a6d |
| Traffic Category | The type of traffic | public, cross-AZ, cross-region, local, unknown A Local value means traffic between resources in the same Availability Zone, which typically does not incur data transfer charges. An Unknown value means Vantage is unable to categorize the type of traffic based on the available metadata. |
| Traffic Path | Path traffic takes to reach the destination, such as through a virtual private gateway | - In VPC - Internet Gateway or Gateway VPC Endpoint - Virtual Private Gateway - Intra-Region VPC Peering - Inter-Region VPC Peering - Local Gateway - Gateway VPC Endpoint (Nitro-based instances) - Internet Gateway (Nitro-based instances) |
| VPC ID | ID of the source VPC | vpc-12a34567b8g8a03ef |
To derive the hostname, Vantage checks against some hardcoded IP ranges, and then falls back to reverse DNS lookup for the IPs. If you have services with known IP ranges you want added, contact support@vantage.sh.
Apply Filter Criteria
You can add additional fields via grouping and filtering criteria. To add a new filter:Click the Filters button on the top left of the diagram.
- The AWS costs where… tile is displayed. Click + New Rule.
- From the filter dropdown menu, select an option, like Account ID, Instance ID, etc.
- Two additional dropdown menus are displayed. Select is, is not, contains, or does not contain based on your desired filter criteria, then select one or more values from the second dropdown menu. For contains or does not contain, enter any text criteria to filter by.
If you are unable to see any values for a filter, this means that you are not capturing this information in your VPC Flow Logs format, and therefore, Vantage is unable to import this data.
- Click Add.
Click to view example image
Click to view example image
You can optionally edit your existing rule or add additional filter criteria.
- To edit the rule you just created, select the rule, make your changes, and click Add.
- If you want to add a rule to filter multiple criteria, such as filter by certain Regions and another rule to filter by certain Destination Hostnames, click + New Rule. Add the additional criteria and click Add.
- To add a separate rule set, above the filter set, click + New Filter. This rule set will be displayed as Or AWS costs where… on the new tile.
- To delete a rule set, click the trashcan icon on the top right of the rule set.
Click to view example image
Click to view example image
Apply Grouping Criteria
To add additional columns to the table and diagram, expand the Group By menu. Select or deselect grouping criteria. As you add grouping criteria, additional nodes and flows are displayed on the diagram. Additional columns are also added to the table for any new grouping criteria.Adjust Flow Weight
By default, the Sankey diagram is weighted by estimated cost. You can change this view to be weighted by bytes, or volume. Above the chart, click the Flow Weight menu and select Costs or Bytes. The Sankey diagram is updated accordingly. When you hover over a flow, the corresponding cost or volume in bytes is displayed in the tooltip.View Flow Log Metadata
For certain grouping criteria, you can view additional details about specific resources. Vantage provides this information when it can fetch provider resource metadata. If Vantage can resolve the IP address for the Source Address and Destination Address grouping criteria, it will also provide metadata for these groupings.Expand the Group By menu and add one or more of the following options to your grouping criteria:
- Interface ID/Peer Interface ID
- Subnet ID/Peer Subnet ID
- VPC ID/Peer VPC ID
- UUID/Peer UUID
Flow Log Sampling
Depending on the scale of your VPC and the volume of flow logs that Vantage needs to process, sampling may be automatically enabled for your account. When sampling is active, Vantage ingests a representative subset of your flow log records rather than the full dataset. This trade-off allows Vantage to process large volumes of flow log data efficiently while still providing meaningful proportions and comparisons of your network traffic. When sampling is active, the Flow and Cost columns in the report table show estimated totals that have been scaled up from the sampled data to approximate what the full, unsampled traffic would look like. An info icon is displayed next to both column headers. Hover over this icon to see the maximum sampling rate that was applied to the data in the current report view.Sampling is enabled automatically by Vantage based on the scale of your environment. You do not need to configure or manage sampling directly.
Estimated Cost Calculation for Network Flows
The estimated cost for each flow is calculated by applying your blended data transfer rates to the flow of traffic. For example, if a flow is moving between one subnet to another and those subnets are in different Availability Zones, Vantage applies your cross-AZ data transfer rate to those bytes.Because data transfer rates can be tiered, and the metadata associated with the destination may change, this calculation is a best-effort calculation; however, it does help to identify cost hotspots within your network.
- is the total number of data flows.
- is the rate (cost per unit of data) for the -th flow.
- is the volume of data transferred for the -th flow.
Network Costs on Cost Reports
On Cost Reports, for resources that generate network traffic costs (e.g., NAT Gateways), a Network Costs button is displayed in the Cost Report list. Click this button to view a Network Flow Report that is filtered to flows coming from that specific resource. The below Cost Report is grouped by Service and Resource.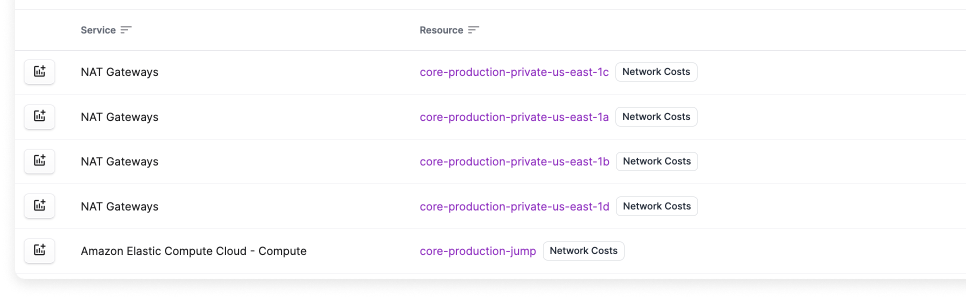
Network Flow Report Examples
The following examples demonstrate common scenarios for using Network Flow Reports. These examples are based on the three reports that Vantage provides by default: All Network Flow Logs, Cross-AZ Traffic, and Public Traffic Destinations.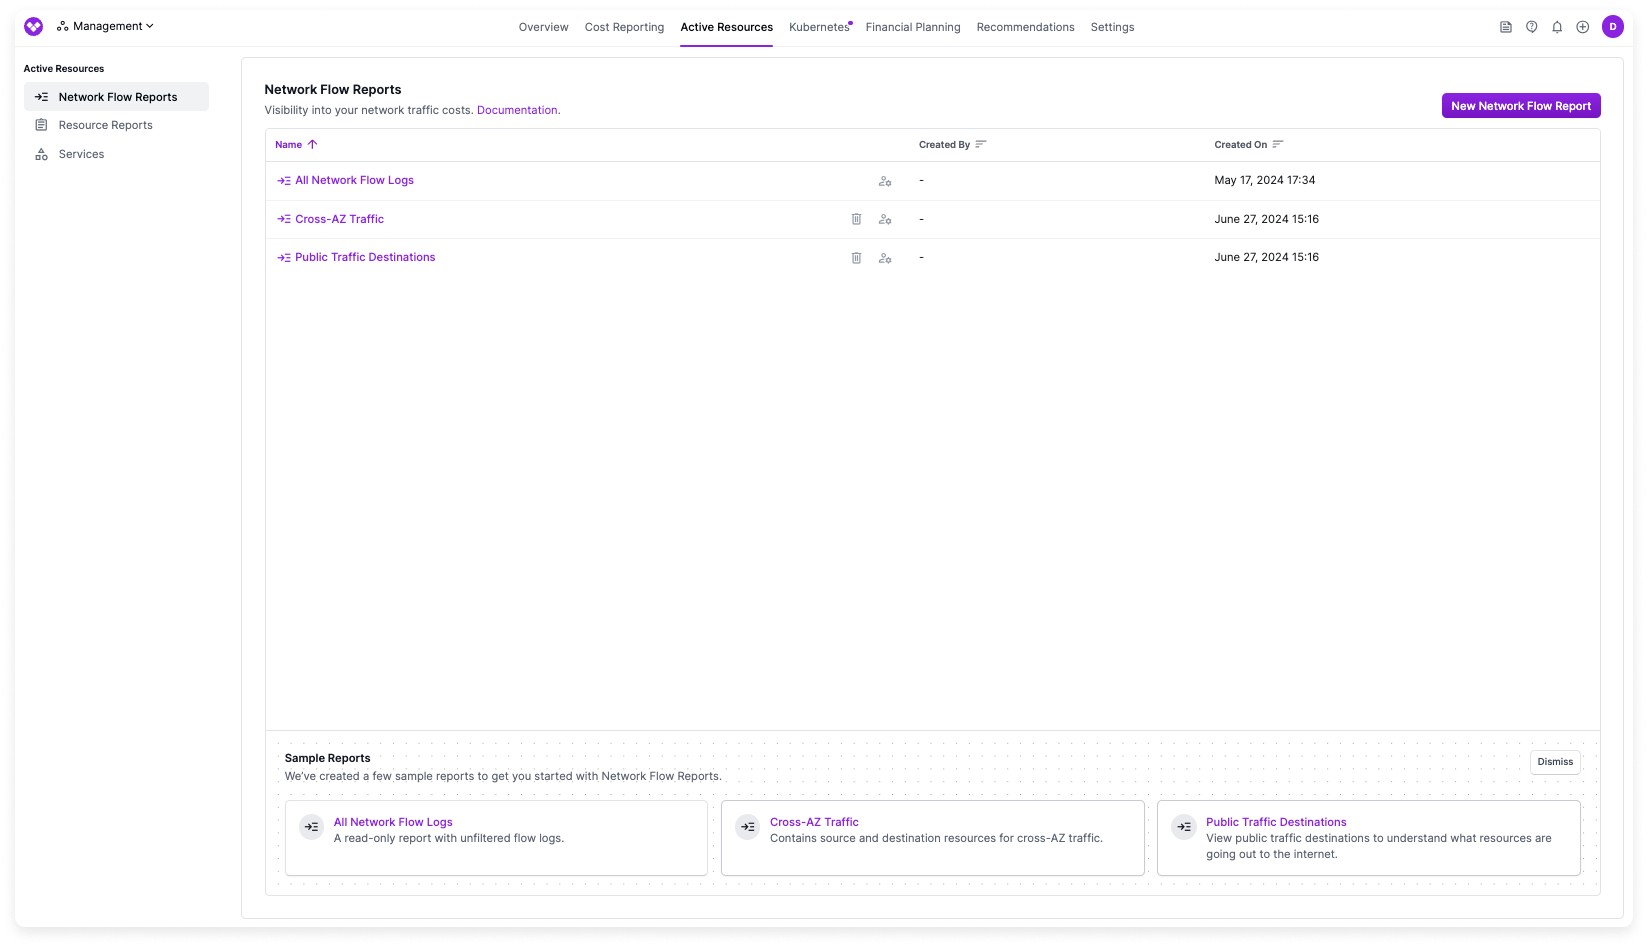
Example 1 - View All Network Traffic
The All Network Flow Logs report shows all your network flows. The flow’s Resource UUID and Peer Resource UUID are provided as well as the traffic category (e.g., public). Review this report to get a high-level view of all your traffic flows.Example 2 - Identify Cross-AZ Traffic
Cross-AZ data transfer within AWS incurs higher costs compared to intra-AZ data transfer. According to AWS, “For data transferred between a Local Zone and an Availability Zone within the same AWS Region, “in” to and “out” from Amazon EC2 in the Local Zone” data is charged at $0.01/GB for both transfer in and transfer out. Transferring data between AZs requires more network bandwidth compared to transferring data within the same AZ. This additional bandwidth consumption contributes to higher costs. In the provided cross-AZ report, you can view all cross-AZ traffic along with flow size and estimated cost. The Peer Availability Zone ID column shows exactly where the traffic is flowing. You can see both the source and peer AZs along with the associated source and peer resources.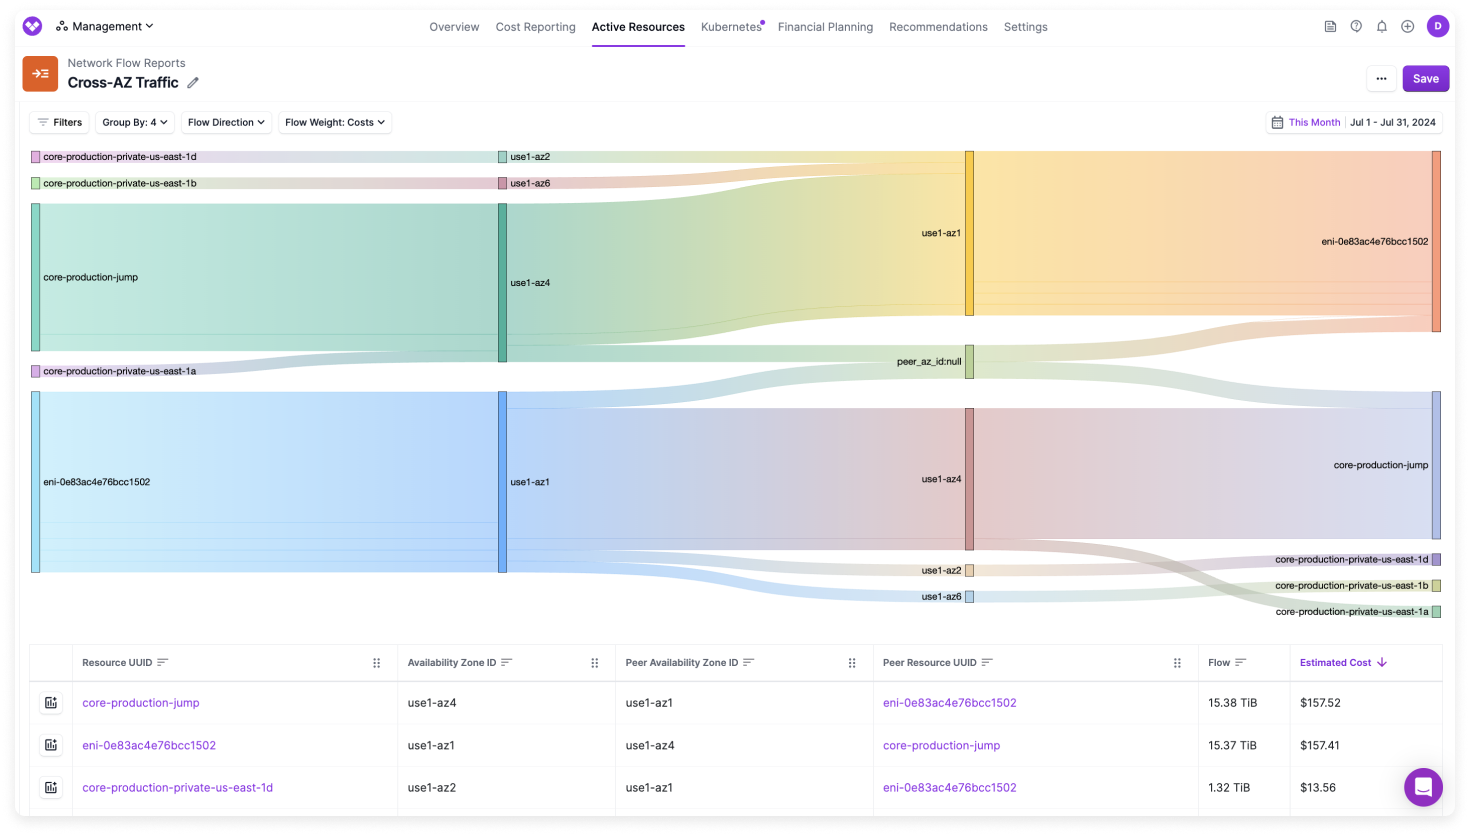
- Try to place dependent resources within the same AZ to minimize cross-AZ data transfer.
- Use VPC endpoints to route traffic internally within AWS, reducing the need for cross-AZ traffic. This can help in minimizing data transfer costs and enhance security by keeping everything in the same VPC.
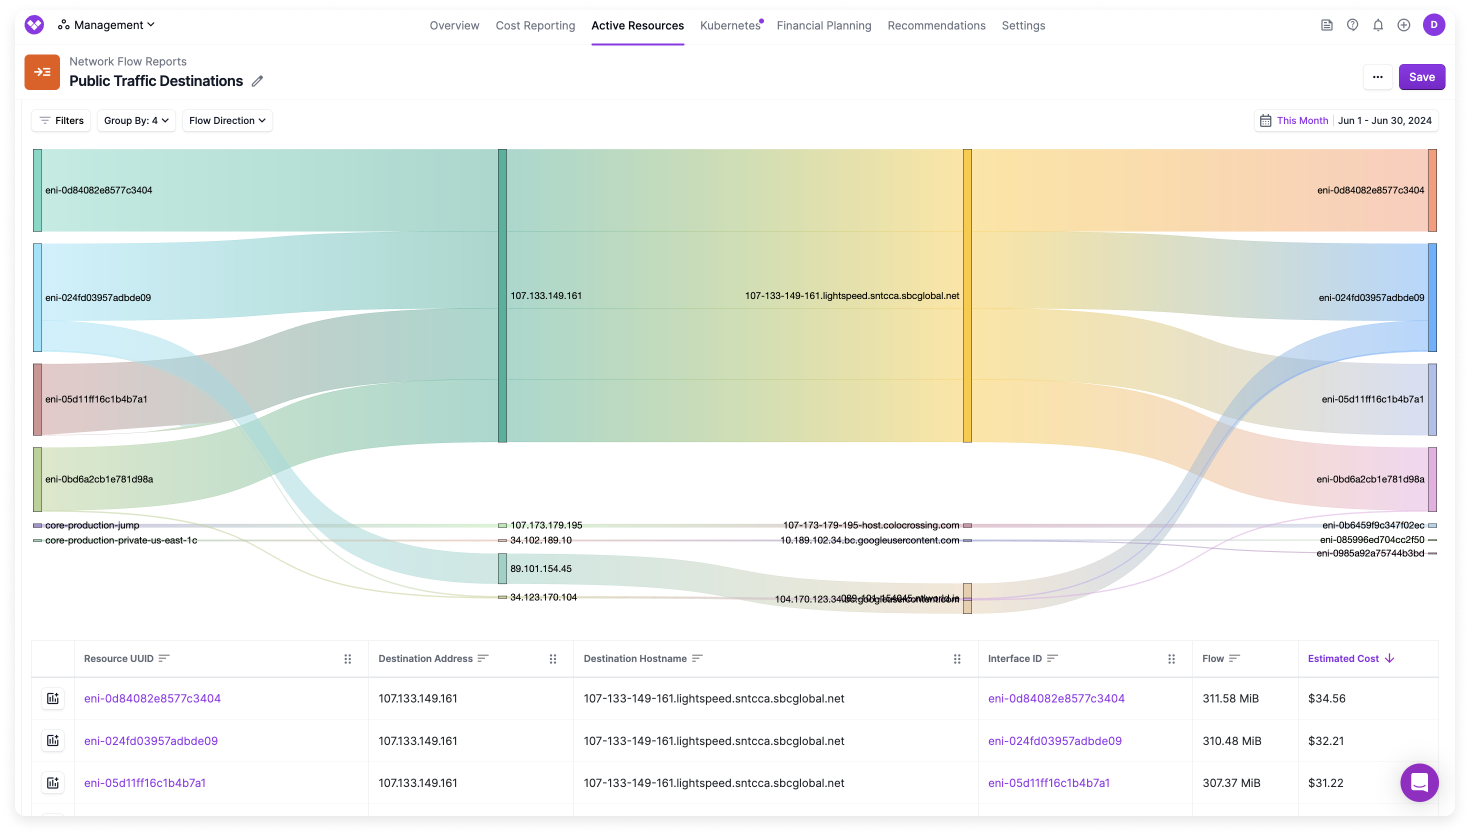
Example 3 - Examine Public Traffic
When monitoring network costs, analyzing public traffic can reveal significant insights about where your traffic is going when it reaches the public internet. By analyzing destination details, you can ensure that traffic is taking the correct path or is going only to trusted and necessary endpoints. In this report, the Destination Hostname grouping/column provides a human-readable format of the destination, helping you quickly identify known destination services or endpoints.