- Baseline Forecast: A time-series forecast based purely on historical cost trends, accounting for seasonality and one-off spikes. This is the default forecast type for all Cost Reports.
- Dynamic Forecast: A forecast that you create by uploading projected values of business metrics (such as subscribers, API requests, or transactions) that influence your underlying costs. This forecast type analyzes historical correlations between costs and business metrics to create more accurate projections that align with your business growth expectations.
Dynamic forecasting is available to Enterprise customers only.
Baseline Forecast
To view a baseline forecast on a Cost Report, create a new Cost Report and save it. After you create a new Cost Report, a message is displayed that indicates the forecast is generating. The processing time depends on the amount of data contained in the filtered report, but it usually takes less than 10 minutes.Your forecast duration will match your data retention within Vantage. For example, if you have 6 months of retention, you are able to forecast 6 months into the future.
If you add additional filters to an existing report, you need to save the report again for the new forecast to generate. Forecasts are generated based on saved data.
1
On the left, under Forecast Periods, select either Next Month, Next 3 Months, or Next 6 Months.
2
Click Apply. Change to either the bar or line chart view to see a forecast.
- Bar Chart View
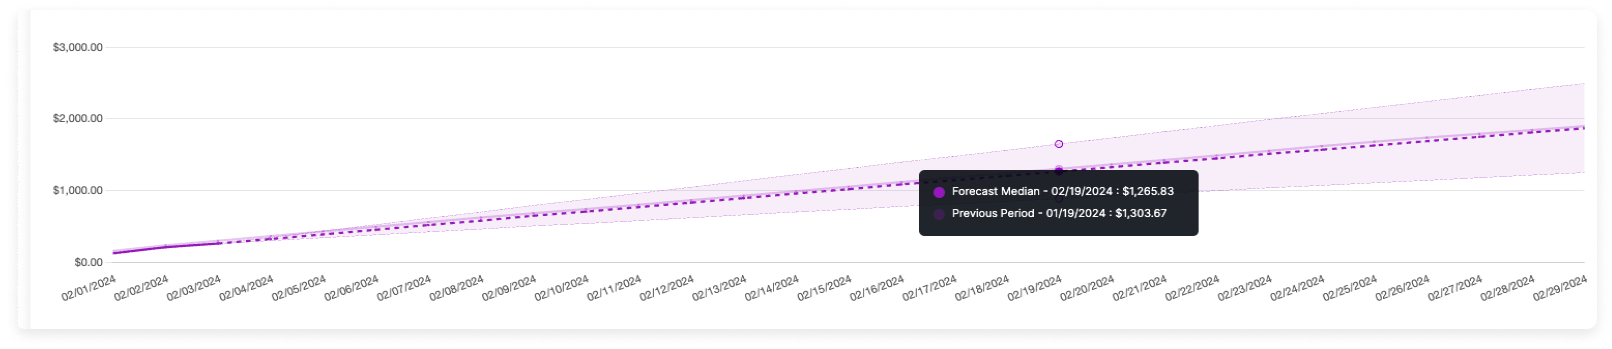
- Line Chart View
In the below example image, bars for future months are light purple. Error bars are present for future months to represent the upper and lower bounds of the forecast. When a date bin (day, week, or month) spans both past and future dates, the bar is partially purple to indicate the portion that is forecasted. For example, in this report binned weekly, the bar for January 19, 2026 is partially purple because that week includes both past and future dates; only the future portion of that week’s bar appears in purple. You can hover over any future date to see the forecasted min, max, and median. Total forecasted costs are displayed above the chart, next to currently accrued costs. Forecasts are also present in grouped bar charts.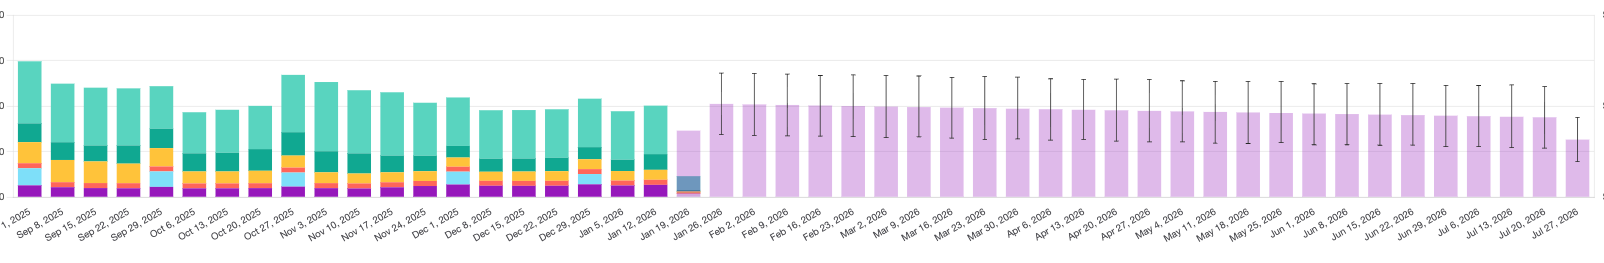
View Service Forecasts
In addition to aggregate forecasts on Cost Reports, you can also view a per-service cost forecast. On any Cost Report, select a row from the table. An individual forecast is displayed for the selected service.Dynamic Forecast
Dynamic forecasting is available to Enterprise customers only.
How Dynamic Forecasting Works
Dynamic forecasting uses machine learning to learn how your business metrics correlate with costs by analyzing historical data. Vantage combines historical business metrics with your projected business metrics into a continuous time series. It then analyzes historical cost data alongside historical business metric values to learn correlation patterns and how changes in your metrics relate to changes in costs. Your forecasted business metric values are then incorporated into the forecasting model, which generates future cost predictions by applying the learned correlations to your projected metrics while accounting for baseline cost trends, seasonal patterns, and service-specific scaling factors. This process runs separately for each cloud service (EC2, RDS, S3, etc.) to account for how different services respond differently to business metric changes, and forecasts are constrained to date ranges where both historical and forecasted metrics exist, with label filters applied when specified. Example use cases are noted below.- Product Launch
- Seasonal Growth
- Testing Cycles
A SaaS company is launching a new feature and expects a 200% increase in API requests over the next three months. They have a business metric tracking API requests per day. By uploading projected API request values for the launch period, their cost forecast automatically adjusts to reflect the anticipated increase in compute and data transfer costs associated with the traffic spike.
Create a Dynamic Forecast
1
Set up your business metric and forecasted data
Follow the steps in the Forecasted Metrics section of the Business Metrics page to create a business metric, upload historical data, upload forecasted metrics, and assign it to a Cost Report.
2
View your dynamic forecast
Navigate to the associated Cost Report and click the Forecasts tab. The Forecasts tab displays a side-by-side comparison table showing forecasted costs by month for each forecast type: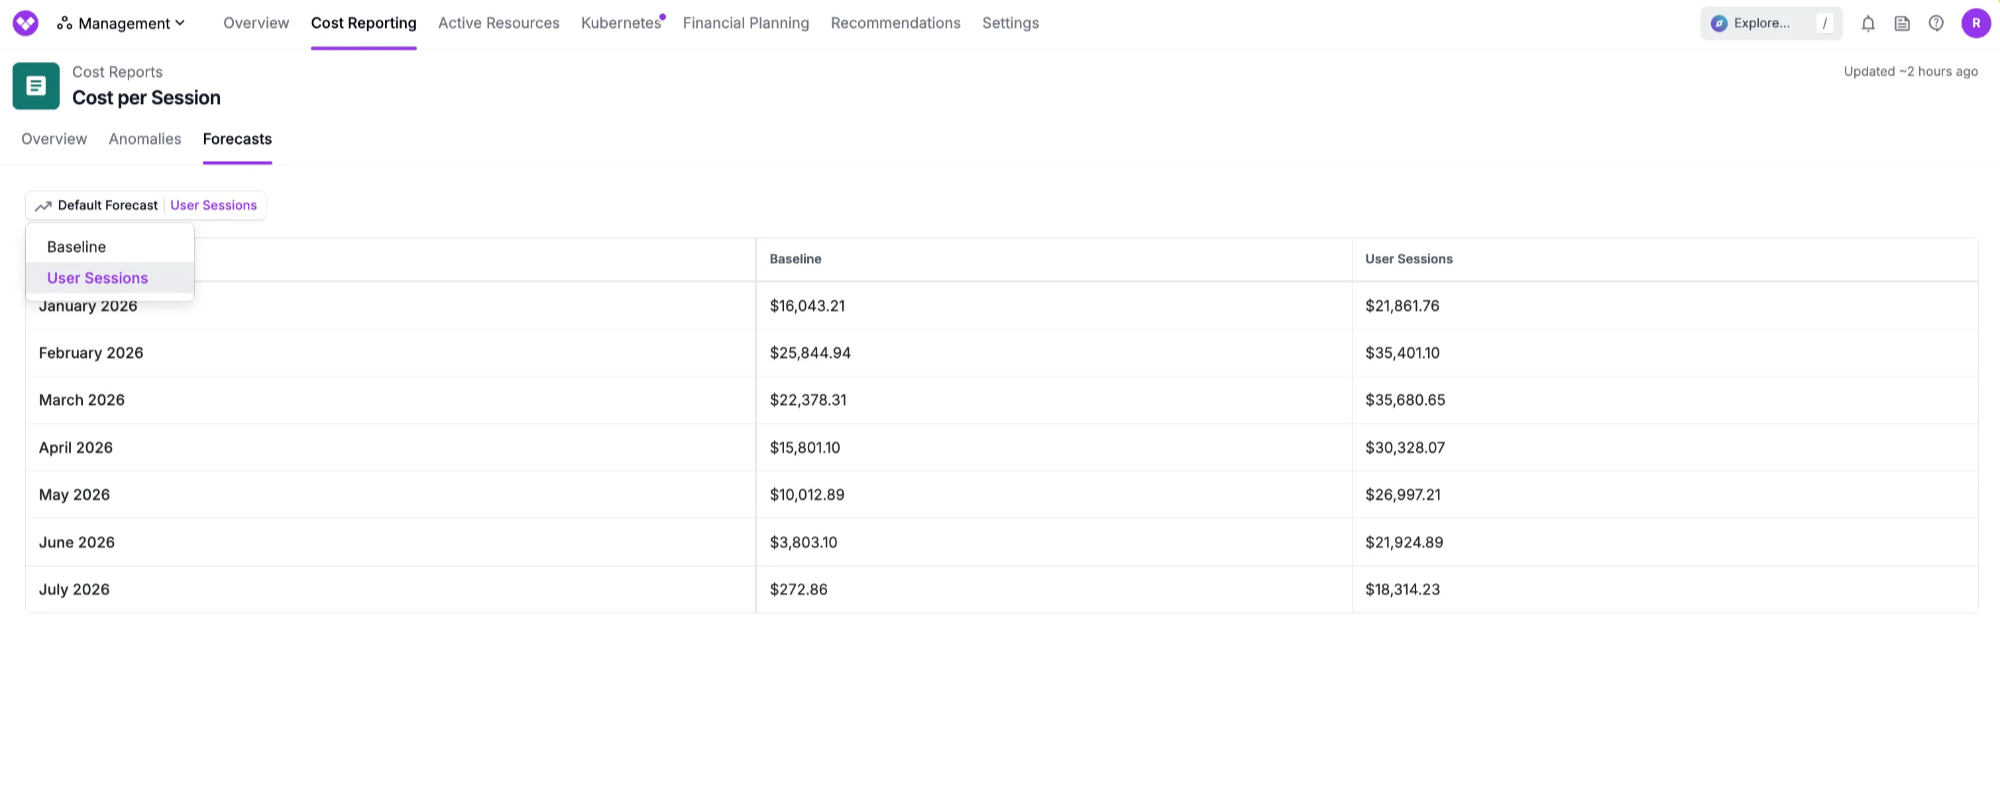
- Baseline: The default time-series forecast based on historical trends
- Dynamic (based on a business metric): Forecasts that incorporate projected business metric values (one for each business metric assigned to the report)
On this tab, if no forecasts are available yet, you’ll see a “Generating Forecast” message to check back once they are done. If only business metric forecasts are still generating, a blue alert banner will indicate which forecast is being generated (i.e., “Generating User Sessions Forecast: Check back once cost data has been processed”). In the forecast table, zero values or periods with no forecast are displayed as a ”-” (dash).