Kubernetes Costs and Efficiency Metrics
Vantage has two sets of tools for viewing and optimizing Kubernetes costs: viewing Kubernetes costs in Cost Reports and viewing Kubernetes efficiency metrics in the devoted Kubernetes page in the console.
- Kubernetes Cost Reports. Use Cost Reports to drill into costs by Cluster, Namespace, Service, and Label, as well as combine Kubernetes costs with other providers, such as a database or cache layer.
- Kubernetes Efficiency Metrics and Reports. Display the cost efficiency down to the pod level of a cluster. These metrics are useful for rightsizing and cost optimization. You can also create efficiency reports based on these metrics.
Kubernetes Cost Reports
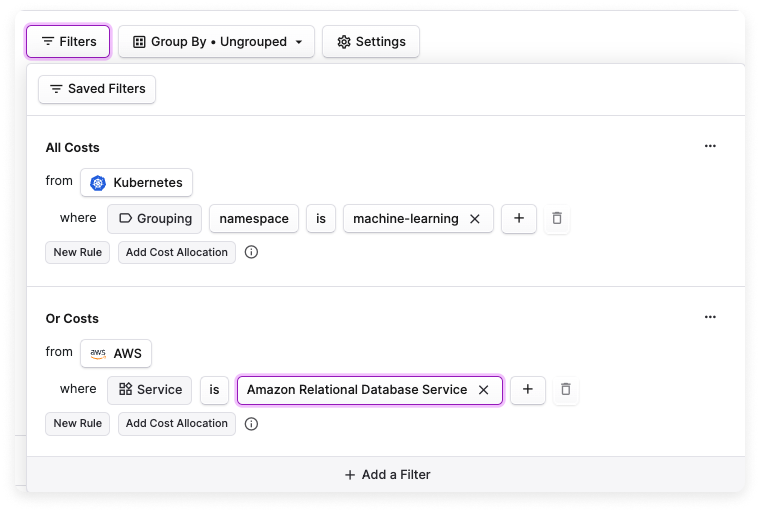
Kubernetes Cost Reports provide cost visibility by Cluster, Label, Namespace, and Service. They include Kubernetes-specific filters and filter logic. You can combine specific Kubernetes costs with other services. In the below example, the filter includes the costs of a specific service with corresponding RDS database costs.
Cost Reports also provide forecasts. These forecasts are updated daily and provide confidence intervals for what your costs are likely to be for the month.
Cost Data Source
The costs displayed on these reports come from your integration with the Vantage Kubernetes agent. The agent calculates the cost of a running pod by analyzing the CPU, RAM, GPU, as well as storage usage and calculates the cost of each input based on the cost of the underlying infrastructure.
Vantage uses a formula to divide the cost of a compute instance into CPU, RAM, and GPU and then computes the cost for each type of resource. The cost calculation reflects the exact runtime of each pod, down to the minute. This means if a pod runs for only 5 minutes within an hour, Vantage recognizes only 5 minutes of spend, rather than the full hour. All the cost allocation calculations are done locally in your cluster and make this data available for querying.
Kubernetes costs are not included in monthly tracked infrastructure costs as they’re already captured from underlying EKS, GKE, or AKS costs.
Kubernetes Efficiency Metrics and Reports
CPU/memory rates are based on the underlying instances the pod is scheduled on. In Kubernetes Efficiency Reports, this is the undiscounted rate of the instance. Discounts are not reflected on these reports. You can view discounts on Kubernetes Cost Reports.
View Kubernetes Efficiency Metrics
- Navigate to the Kubernetes page in the Vantage console.
- On the left navigation menu, select an option to view connected Clusters, Namespaces, or Labels. Each view contains a graph as well as a table with the following headings:
- Name: The name of the Cluster, Namespace, or Label you’re viewing.
- Idle Costs: A dollar value representation of the number of resources requested that are idle.
- Total Costs: A dollar value representation of the total cost of the resources.
- Cost Efficiency: The ratio of idle costs and total costs.
- Filter a cluster's efficiency metrics by date or resource:
- From the top right of the graph, change the date range to see how costs have changed over time.
- From the resource list below each chart, click the icons next to each resource to view different aggregations. Click the View on chart button to isolate that specific resource on the chart.
Create Efficiency Reports
With Kubernetes efficiency reports, you can filter your Kubernetes cost data and create reports based on these filters. You have the option to filter for costs by Cluster, Namespace, or Label.
Labels will include namespace labels and annotations if enabled in your Vantage Kubernetes agent integration.
- Navigate to the Kubernetes page in the Vantage console.
- On the left navigation menu, select Efficiency Reports. All existing Kubernetes efficiency reports will be listed, along with who created the report as well as the date when the report was created.
- From the top right of the screen, click New Report. Like the efficiency metrics view, a chart/graph with idle costs is displayed. Below the chart, a table is displayed with the following columns: the resource's name, Idle Costs, Total Costs, and Cost Efficiency.
- To filter costs, click the Filters button on the top left of the chart.
- The Kubernetes costs where... tile is displayed. Click + New Rule.
- From the filter dropdown menu, select either Cluster, Namespace, Category (cpu, ram, or gpu) or Label.note
See the section below for information on how to enable GPU metrics.
- Two additional dropdown menus are displayed. Select is or is not based on your desired filter criteria, then select one or more Clusters, Namespaces, or Labels from the second dropdown menu.
- Click Save.
Click to view visual example
- You can optionally edit your existing rule or add additional filter criteria.
- To edit the rule you just created, select the rule, make your changes, and click Save.
- If you want to add a rule to filter multiple criteria, such as filter by certain Clusters and another rule to filter by certain Namespaces, click + New Rule. Add the additional criteria and save.
- To add a separate rule set, click + New Filter. This rule set will be displayed as Or Kubernetes costs where... on the new tile.
- To delete a rule set, click the trashcan icon on the top right of the rule set.
Click to view visual example
- Above the rule set(s), click Apply. The graph will update with your existing filter criteria.
- You have the option to further drill down into your costs.
- Above the graph, click the Aggregate By dropdown menu. Select either Idle Costs or Total Costs.tip
Selecting one of these options will also make those costs the default sort for the table.
- To adjust aggregation dimensions, above the graph, click the Group By dropdown menu. Select one or more of the following options: Cluster, Namespace, and specific Label Key/Label Value.
- To adjust the date binning, select the menu on the top right of the graph. Select either Daily, Weekly, or Monthly.
- To change the date range, click the date picker menu on the top right of the graph and adjust the date range.
Click to view visual example
- Above the graph, click the Aggregate By dropdown menu. Select either Idle Costs or Total Costs.
- To save the report, click Save as New and enter a report name. Then, click Save. (To edit this name, click the pencil icon in the breadcrumbs above the chart, next to the report's name.)
You can edit the filter criteria on a report at any time. Remember to click Save once you are done making changes.
Add an Efficiency Report to a Dashboard
You can add your efficiency reports to dashboards. These reports will be displayed on the dashboard, along with other cost and segment reports.
- From the top navigation, click Cost Reporting.
- From the side navigation, click Dashboards.
- Select an existing dashboard, or click + New to create a new dashboard.
- If you are creating a new dashboard:
- Enter a Name.
- Under Add Reports, find and select your Kubernetes efficiency report.
- Click Save.
- If you want to add the report to an existing dashboard:
- From the top right of the existing dashboard, click Edit.
- Under Add Reports, find your efficiency report.
- Click Save.
- If you are creating a new dashboard:
Efficiency Calculations
Pod resource efficiency is defined as the resource utilization versus the resource request over a given time window. These resource utilization metrics include CPU and RAM. When viewing efficiency, it will be shown as a percentage. 100% means the resource allocation is fully efficient.
Idle costs are defined as the difference between the cost of requested resources (CPU and Memory) and the associated usage of those costs:
idle_cost = (cpu_request_cost - cpu_usage_cost) +
            (memory_request_cost - memory_usage_cost)
Kubernetes GPU Idle Costs
For each Kubernetes pod, you can view the idle and total costs for NVIDIA GPU usage within a Kubernetes cluster. GPU memory usage is available on Kubernetes efficiency reports as an option for the Category filter and is included in the cost efficiency score per pod.
How GPU Idle Costs Are Calculated
When an instance includes GPUs, 95% of the cost of the node will be allocated to the memory of the GPU. The number of GPUs requested by the pod will dictate how much of the total memory is allocated to the pod. Idle costs for allocated GPUs are determined by calculating the difference between the total allocated and the total used memory for the pod, down to the container level:
idle_memory = total_allocated_memory - used_memory
GPU utilization is not factored into the efficiency calculation; only GPU memory is tracked. If you have a workload that requires tracking GPU utilization, contact support@vantage.sh.
Configure GPU Metrics
The Vantage Kubernetes agent automatically collects GPU usage information via the NVIDIA DCGM Exporter. The exporter is included as part of the NVIDIA GPU Operator, but it can also be installed independently. The agent scrapes the exporter directly and exposes the configuration for the namespace, service name, port name, and path. The default values are configured for the GPU operator default case. NVIDIA GPU idle costs are available for the agent-supported infrastructure providers—AWS, Azure, and GCP.
Vantage Kubernetes Agent Configuration
Install or upgrade to Vantage Kubernetes agent version 1.0.26 or later, available as part of Helm Chart version 1.0.34. To collect GPU metrics, set the following parameter to true in the agent's values.yaml: -set agent.gpu.usageMetrics=true.
The agent also provides some additional GPU configuration options. The defaults match the operator's defaults. Refer to the agent’s values.yaml for option configuration details.
Configure the Operator
For net-new installations:
- To configure the
dcgm-exporterto collect custom metrics, retrieve the metrics file and save it asdcgm-metrics.csv:curl <https://raw.githubusercontent.com/NVIDIA/dcgm-exporter/main/etc/dcp-metrics-included.csv> > dcgm-metrics.csv - Add the
DCGM_FI_DEV_FB_TOTALmemory metric to the metrics file:....
# Memory usage
DCGM_FI_DEV_FB_FREE, gauge, Framebuffer memory free (in MiB).
DCGM_FI_DEV_FB_TOTAL, gauge, Framebuffer memory total (in MiB).
DCGM_FI_DEV_FB_USED, gauge, Framebuffer memory used (in MiB).
... - Create a
gpu-operatornamespace:kubectl create namespace gpu-operator - Create a ConfigMap from the metrics file:
kubectl create configmap metrics-config -n gpu-operator --from-file=dcgm-metrics.csv - Follow the steps provided in the NVIDIA GPU Operator installation guide to install the operator. Set the following options on the operator:
--set dcgmExporter.config.name=metrics-config--set dcgmExporter.env[0].name=DCGM_EXPORTER_COLLECTORS --set dcgmExporter.env[0].value=/etc/dcgm-exporter/dcgm-metrics.csv.
Once the operator is installed, the Vantage Kubernetes agent will begin to upload the data needed to calculate the idle costs. The data will be available on efficiency reports within 48 hours as the costs from the infrastructure provider are ingested.
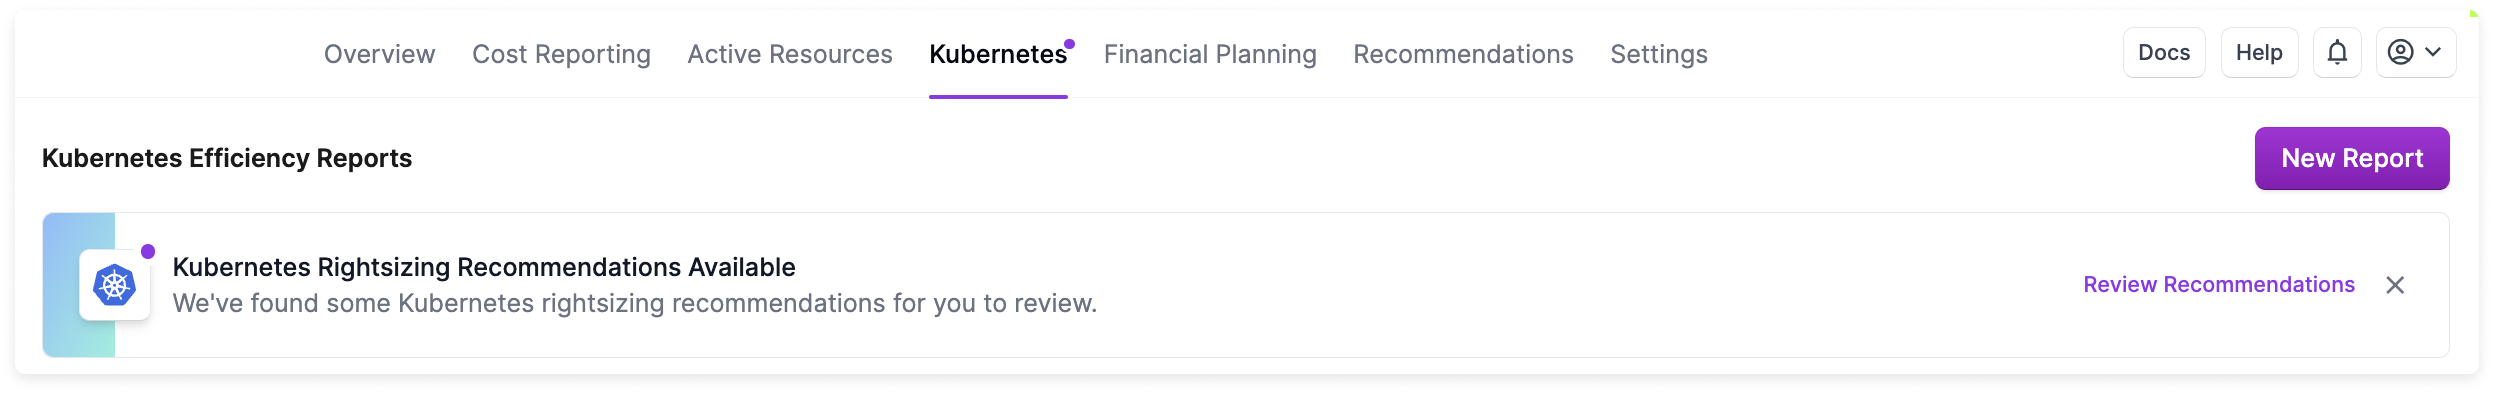
Kubernetes Rightsizing Recommendations
Vantage syncs Kubernetes managed workloads as active resources in your account. In cases where any of these workloads are identified to be overprovisioned, Vantage provides Kubernetes rightsizing recommendations. On the Kubernetes Efficiency Reports screen, a notification is displayed when rightsizing recommendations are available. Click Review Recommendations to view identified workloads.
See the Cost Recommendations documentation for details on how to view this information and rightsize Kubernetes workloads.
Kubernetes Integration Method: The Vantage Kubernetes Agent
Agent usage data is uploaded several times throughout the day and updated within the Vantage platform nightly. However, Kubernetes costs will not be calculated until the costs from the cluster’s corresponding infrastructure provider are available. These costs might encounter delays based on their associated cloud integration's cost data. For instance, if there is a one-day delay in an AWS Cost and Usage Report, the clusters dependent on that data will experience a similar delay. This often takes 48 hours to complete.