

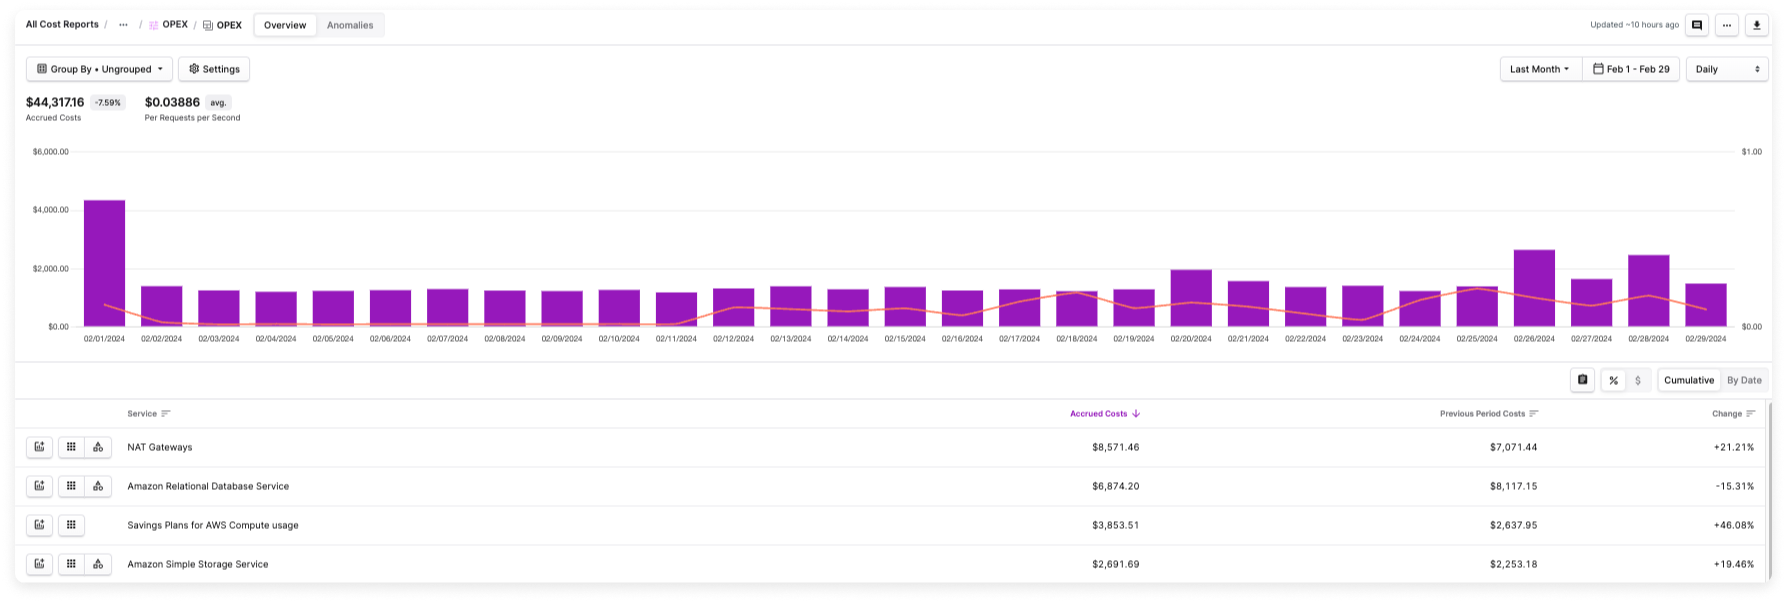
Labeled Business Metrics
You can optionally attach one or more named label columns to each uploaded metric value. Label columns identify the business dimensions of the metric—such as application, team, environment, or cost center—so a single metric can model the same usage across several dimensions without duplicate metrics or delimiter workarounds. For example, a metric like Weekly Active Users might include columns forapplication, team, and environment. When you assign that metric to a Cost Report or use it in a Virtual Tag, you choose which label column to use for the calculation or allocation. The same underlying metric can power a cost-per-application view, a cost-per-team view, and a cost-per-environment view by selecting a different column in each place.
When you filter by label values on a Cost Report, any selected values for a column are aggregated in the calculation. For example, if you select the application column and include only app1, the calculation uses only that set of data. If you also include app2, the calculation aggregates both.
Multiple label columns are supported when you import via CSV, ClickHouse, Datadog, GCP BigQuery, Metronome, or Snowflake. Amazon CloudWatch metrics carry a single label column.
A single business metric supports up to 100 label columns, and each column can have an unlimited number of values.Business metrics created before multiple label columns were supported continue to work with their single
label column. To use multiple label columns, delete the existing metric and create a new one, then reassign it to its Cost Reports and Virtual Tags.Import Business Metrics
Business metrics can be imported from other systems directly into Vantage and analyzed alongside cost data. You can automatically import metrics from Amazon CloudWatch, ClickHouse, Datadog, GCP BigQuery, Metronome, and Snowflake; import them manually from a CSV file; or upload them via the Vantage API.The following steps are for creating a Business Metric and importing historical metrics. If you want to automatically import metrics from another application, see Import via the Vantage API.
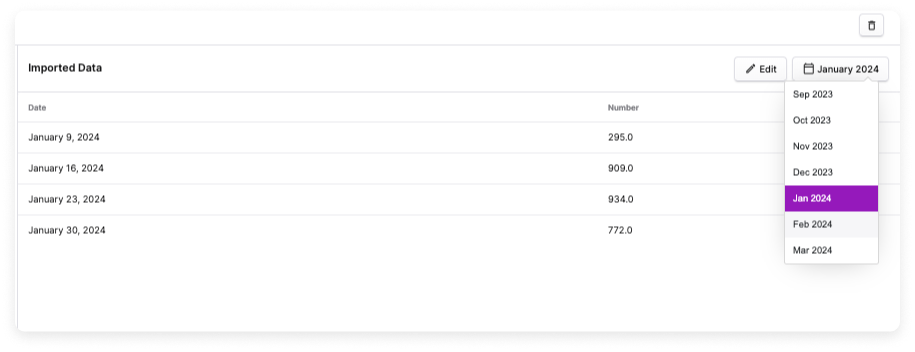
Imports load one billing period (month) at a time. On the Imported Metrics tab, each month in the period picker shows its own import state—a month still being imported is labeled Importing… and its data appears automatically once ready, while a month that could not be imported is labeled Failed. You can review completed months while others are still processing.
1
From the top navigation, click Financial Planning.
2
On the left navigation, click Business Metrics. All existing business metrics are displayed. You can edit or delete business metrics from this screen.
3
From the top right of the screen, click New Business Metric.
4
Enter a business metric Title and click Create Business Metric.
5
The Business Metrics screen is displayed with three tabs:
- Metric Overview: Displays basic metric information (name, import type, integration details) and allows you to assign the metric to Cost Reports. See the Assign Business Metrics to Cost Reports section for details.
- Imported Metrics: Import historical business metrics from a CSV file, Amazon CloudWatch, ClickHouse, Datadog, GCP BigQuery, Metronome, Snowflake, or upload via the Vantage API. This tab stores your historical metric data and is used for calculations on Cost Reports. While you can upload any dates (past, present, or future) to this tab, only dates up to the current cost buffer date are used for calculations. Future dates uploaded here are stored and will automatically appear on Cost Reports once that date becomes current (passes the cost buffer). Only data uploaded to the Forecasted Metrics tab will be used for Dynamic Forecasting.
- Forecasted Metrics: Upload future projections of your business metrics to create Dynamic Forecasts. Only data uploaded to this tab will be used for Dynamic Forecasting. See the Forecasted Metrics section for details.
Import from a CSV File
You can upload a CSV file that uses the following format. This CSV file can replace existing data or be used to import new data. Thedate and amount columns are required. The date column must be in YYYY-MM-DD format, and the amount column must be a number. Every additional header becomes a named label column, and column order does not matter. Label columns are optional: you can provide a single column (for example, label), several named columns, or none at all. CSV uploads must be under 25 MB.
Each row must be a unique combination of
date plus its label values. Duplicate rows are rejected. For example, in the CSV below, 2024-01-09,295,app1,payments,production and 2024-01-09,344,app2,checkout,staging are both valid because their label values differ, but a second 2024-01-09,...,app1,payments,production row would be a duplicate.Click to view visual example
Click to view visual example
- Dates present in the new file fully replace the stored values for those dates.
- Dates omitted from the new file carry forward their previous values.
Import from Amazon CloudWatch
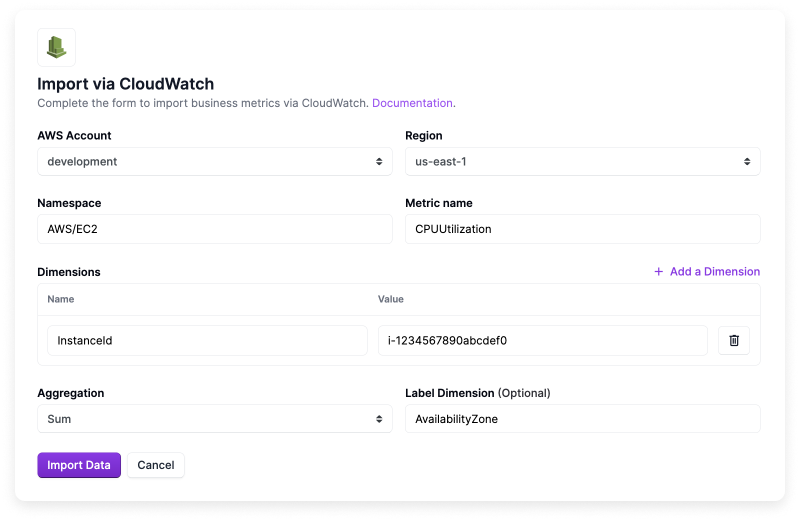
To import business metrics from Amazon CloudWatch, you need a specific metric name and AWS account, as described below. Ensure AWS is one of your connected providers.If Vantage does not have a Cross-Account IAM Role associated with your AWS account, you need to create one. See the AWS integration documentation for details.
1
Click the Imported Metrics tab, then click Import via CloudWatch.
2
For AWS Account, select the connected AWS account you want to import metrics from.
3
Select an AWS Region.
4
Enter a Namespace. A complete list of available namespaces can be found in the AWS documentation for AWS services that publish CloudWatch Metrics. Namespaces start with
AWS/ followed by the service name (e.g., AWS/EC2).5
Enter a Metric name. Each AWS service has metrics that it sends to CloudWatch. Available metrics can be found in CloudWatch or the AWS documentation.
6
For Dimensions, enter a Name and Value. Dimensions are used to pull specific statistical data for a metric. For example, enter
InstanceId with a value of i-1234567890abcdef0. Each CloudWatch metric has a set of dimensions you can select. Click + Add a Dimension to add more than one dimension.7
For each import, you must specify the Aggregation function to be used because metrics will be aggregated to the day. Select either Sum, Average, Maximum, or Minimum.
8
Optionally, enter a dimension name for the Label Dimension field.
9
Click Import Data.
Click to view visual example
Click to view visual example
Import via ClickHouse
To import business metrics from ClickHouse, ensure ClickHouse Cloud is one of your connected providers. Rather than entering SQL in Vantage, you save the query in ClickHouse Cloud and expose it as a query API endpoint, then give Vantage the endpoint ID. The endpoint must be shared with the API key from your ClickHouse Cloud integration. The Billing and Service reader roles used for cost ingestion are sufficient; you do not need an additional role. Scheduled query execution consumes ClickHouse compute in your account. The saved query behind the endpoint must meet two requirements:- Return
dateandvaluecolumns: Thedatecolumn must be convertible by ClickHouse’stoDatefunction. Every other column the query returns becomes a named label column, named after your SQL alias, so you can returnteam,application,environment, or any dimension you want to track. Use column aliases (AS) if your source table uses different column names. - Declare
start_dateandend_datequery parameters and filter on them: Vantage imports one month at a time and passes that month’s boundaries to the endpoint as these parameters. Both bounds are inclusive.
ClickHouse imports use
value in the SQL result set. CSV and API imports use amount for the metric value.2026-01-01, 1500000, team-a, production, where date is the usage date, value is the number of events, and team and environment are label columns. You could then attach that metric to a Cost Report and use a Unit Scale like Per Million to view cost per million events. For allocation use cases, label columns can represent teams, applications, customers, or cost centers.
1
Save the query in ClickHouse Cloud
In the ClickHouse Cloud SQL console, write a query that returns
date, value, and any label columns you want to track, filtered on the start_date and end_date parameters. Then click Save. For example, the following query imports daily event counts broken down by team and environment:2
Create the query API endpoint
With the saved query open, click Share, then select the API Endpoint tab.
- Under API Keys, select the API key you used to connect ClickHouse Cloud to Vantage.
- Under Access control, select the database roles used to run the query. Read only is sufficient, since Vantage only reads data.
- Leave Allowed domains empty. This setting controls browser (CORS) access, and Vantage calls the endpoint from its own servers.
3
Copy the query endpoint ID
After you save, ClickHouse displays the endpoint URL and an example request. The endpoint ID is the UUID in that URL, such as
7c6a3a87-12fd-41f5-afdf-caa4697a2886. Copy only the UUID, not the full URL.4
Configure the import in Vantage
In Vantage, click the Imported Metrics tab, then click Import via ClickHouse. If you have not connected ClickHouse Cloud, click Connect ClickHouse and complete the ClickHouse Cloud integration setup first.For ClickHouse Connection, select the connected ClickHouse organization that owns the endpoint. Then paste the UUID into Query Endpoint ID and click Import Data.
Vantage only verifies that it can reach the endpoint when you save the import. Problems with the query’s results, such as missing columns or an oversized result, are reported on the Imported Metrics tab instead of blocking setup. A brand-new query that has no data yet is also allowed.
Import from Datadog
To import business metrics from Datadog, ensure Datadog is one of your connected providers. If you do not have Datadog as one of your connected providers, you will be prompted to connect your Datadog account the first time you try to create a metric.1
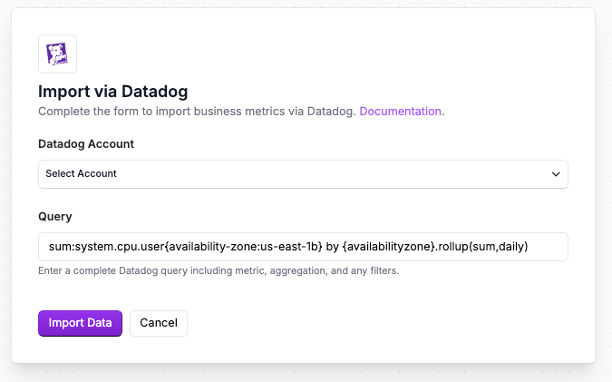
Click the Imported Metrics tab, then click Import via Datadog.
2
For Account, select the connected Datadog account for which you want to import metrics. If this is your first Datadog metric, you may be prompted to reauthorize your Datadog credentials and the required scopes for Vantage (i.e.,
billing_read, usage_read, metrics_read, and timeseries_query scopes).3
For Raw Query, enter your Datadog metric, including aggregation, rollup formula, and label filters, into the text field. Your syntax should be similar to the following example:
The minimum aggregation for business metrics is daily. If you enter a lower granularity than daily, Vantage will perform aggregation at the daily level. For more information on the Datadog filtering syntax, see the Datadog documentation.
4
Click Import Data.
Click to view visual example
Click to view visual example
Import via GCP BigQuery
To import business metrics from GCP BigQuery, you run a SQL query against your own BigQuery data and Vantage imports the results as a business metric. This import reuses the service account from an existing GCP integration, so you don’t create or upload a second credential. Ensure you have a connected GCP detailed billing integration before you start. Vantage uses the selected GCP integration’s service account to run your query, so it needs permission both to run the BigQuery job and to read every dataset the query references:- BigQuery Job User on the project that runs the query (the BigQuery Job Project), which allows
bigquery.jobs.create. - BigQuery Data Viewer on each dataset referenced by the query.
Query execution and validation consume BigQuery capacity in the selected BigQuery Job Project, and you are responsible for those BigQuery charges.
date and value. Every other column your query returns becomes a named label column, named after your SQL alias, so you can return team, application, environment, or any dimension you want to track. Use column aliases (AS) if your source table uses different column names. When you save the import, Vantage validates the query against BigQuery and requires it to return at least one row.
1
Click the Imported Metrics tab, then click Import via GCP BigQuery.
2
For GCP Billing Integration, select the connected GCP integration whose service account has access to the data you want to query.
3
Set the BigQuery Job Project. This is the project where the query runs and where BigQuery charges are attributed. Vantage defaults this to the selected integration’s project, but you can enter another project where the service account has BigQuery Job User.
4
For SQL Query, enter a query that returns
date, value, and any label columns you want to track. Use fully qualified project.dataset.table names, and aggregate to the intended daily and label grain. For example:5
Click Import Data.
GCP BigQuery uses
value in the SQL result set. CSV and API imports use amount for the metric value.Import from Metronome
To import revenue or usage data from Metronome, ensure Metronome is one of your connected apps. Metronome imports create labeled business metrics that can be assigned to Cost Reports, used in Canvas, and queried with the FinOps Agent. Metronome supports two metric types in Vantage:- Daily invoice revenue: Daily revenue from Metronome invoice breakdowns, labeled by customer. Use this for gross margin, customer profitability, and cost as a percentage of revenue.
- Usage: Daily usage from a selected Metronome billable metric, labeled by customer. Use this for unit costs such as cost per compute hour, cost per API request, cost per storage GB-hour, or cost per AI token.
1
Click the Imported Metrics tab, then click Import via Metronome.
2
For Account, select the connected Metronome account for which you want to import revenue or usage metrics. If you have not connected Metronome yet, complete the Metronome integration setup first.
3
Select the Metronome metric you want to import.
- Select Daily invoice revenue to import customer-level revenue.
- Select a billable usage metric, such as
Compute Hours,API Requests,Storage GB-Hours,AI Tokens, orVirtual Machine Hours, to import product usage.
4
Select a Label Source. Labels identify the customer associated with each metric value and power Cost Report calculations and Virtual Tag allocation.
- Use Customer name for readable reporting by customer.
- Use Ingest alias if your Metronome aliases are cleaner or match the identifiers your team uses outside Metronome.
- Use Customer ID when you need stable identifiers or want to troubleshoot customer matching.
Metrics that support multiple label columns import each customer identifier—
customer_id, customer_name, and ingest_alias—plus any customer custom fields as separate label columns, so you can filter and allocate by any of them. The Label Source selection applies to existing single-label metrics.5
Click Import Data.
Import from Snowflake
To import business metrics from Snowflake, ensure Snowflake is one of your connected providers. Vantage uses the selected Snowflake integration to run your query, so the configured Snowflake role needs read access to the tables or views referenced in the query. Scheduled query execution consumes Snowflake credits in your account. Your SQL query must return columns nameddate and value. Every other column your query returns becomes a named label column, named after your SQL alias, so you can return team, application, environment, or any dimension you want to track. Use column aliases (AS) if your source table uses different column names. When you save the import, Vantage validates the query against Snowflake and requires the query to return at least one row.
Snowflake imports use
value in the SQL result set. CSV and API imports use amount for the metric value.2026-01-01, 1500000, team-a, where date is the usage date, value is the number of requests, and team is a label column. You could then attach that metric to a Cost Report filtered to the shared CloudFront distribution and use a Unit Scale like Per Million to view cost per million requests. For allocation use cases, label columns can represent teams, applications, customers, or cost centers.
1
Click the Imported Metrics tab, then click Import via Snowflake.
2
For Snowflake Integration, select the connected Snowflake integration you want to query. If you have not connected Snowflake, click Connect Snowflake and complete the Snowflake integration setup first. Confirm the
vantage user you created during connection has read access to any of the databases and schemas that you want to use for business metrics.3
For SQL Query, enter a query that returns
date, value, and any label columns you want to track. In the shared CloudFront distribution example discussed earlier, the following query imports daily request counts broken down by team and environment:4
Click Import Data.
Import via the Vantage API
You can import business metrics to Vantage, from other applications, with the Vantage API. Use the/business_metrics endpoint to view, create, update, and delete business metrics. You can also delete specific business metric values by date range and label with DELETE /business_metrics/{token}/values. Ensure you have a valid Read/Write Vantage API token. See the API documentation for details on how to use these endpoints.
JSON values and forecasted_values accept a single optional label per row. To import multiple named label columns, upload a CSV with PUT /business_metrics/{token}/values.csv. For a metric that supports multiple label columns, every header other than date and amount becomes a label column. When reading values, GET /business_metrics/{token}/values supports a label_values query parameter to filter by exact label value.
Calculation Types
When you assign a business metric to a Cost Report, you choose a calculation type that determines how Vantage combines the metric with your costs. Each calculation is performed per date bin (day, week, or month) and rendered on a secondary y-axis as a line overlay.You can apply only one calculation type per Cost Report. You can add multiple business metrics to the same report, but they must all use the same calculation type so the secondary axis stays consistent. For example, if a report already uses a Gross Margin calculation, any additional metrics you add to that report must also use Gross Margin.The same business metric can use different calculation types on different Cost Reports. For example, you can apply a Revenue metric as Gross Margin on one report and as Raw Value on another.
Unit Cost
For each date bin, Vantage sums all costs on the report and divides by the summed (and optionally label-filtered) business metric to produce a cost per unit, such as cost per customer or cost per million API requests. This is the original business metric behavior, and existing metric applications continue to use it with no action required. Use the Unit Scale option to divide the business metric before the calculation—for example, to view cost per thousand requests instead of cost per request.Usage Unit Cost
For each date bin, Vantage divides a cloud provider usage quantity by the business metric, producing a ratio like GB-hours per employee or LLM tokens consumed per pull request. Unit Scale applies exactly as it does for Unit Cost.Usage Unit Cost is only available on Cost Reports that expose a usage quantity. Because a report can contain many different usage units, apply a Usage Unit filter so all included costs share the same unit (for example, GBs of storage) before applying this calculation.
Gross Margin
For each date bin, Vantage calculates(revenue − cost) ÷ revenue and renders the result as a margin percentage alongside your costs. Because the result is a ratio, Unit Scale is ignored.
The business metric should represent revenue for this calculation to be meaningful. Metronome daily invoice revenue is a common source for this metric.
Raw Value
Vantage overlays the business metric value as-is on the secondary axis—no calculation is performed. Use this to visually correlate a raw metric, such as customer or transaction volume, against spend over time. Because the value is passed through directly, Unit Scale is ignored.Assign Business Metrics to Cost Reports

1
Under Assigned Cost Reports, click Assign a Report.
2
The Assign a Report popup window is displayed. In the Report dropdown menu, search for and select a Cost Report.
3
For Calculation, select how Vantage should apply the metric to the report: Unit Cost, Usage Unit Cost, Gross Margin, or Raw Value. See Calculation Types for details on each option. If the report already has other business metrics assigned, you must select the same calculation type they use.
4
For Unit Scale, select either Per Unit, Per Hundred, Per Thousand, Per Million, or Per Billion. The scale is used to divide the business metric before calculating the per unit value. Use this scale to create a per-unit cost, such as Cost per Thousand Requests. If you select Per Unit, no division occurs, and the actual metric number will be used within the Cost Report.
Unit Scale applies only to the Unit Cost and Usage Unit Cost calculation types. It is ignored for Gross Margin and Raw Value.
5
For Label Filter, optionally filter the metric by label column and values.
- First select a label column (for example,
application,team, orenvironment), then select one or more values for that column. Selected values within a column are aggregated (OR), and filters across columns are combined (AND). - Click + Add Filter to filter by additional label columns on the same assignment.
- You can assign the same metric to different Cost Reports and select a different label column on each (e.g., cost per application on one report and cost per team on another).
- Select unlabeled to include values where the selected label column is blank.
6
(Optional) For Cost Report Label, enter a custom label that controls how this metric is named on the Cost Report chart and legend. Leave it blank to use the default label for the selected calculation type.
7
Click Save. The metric is displayed on the corresponding Cost Report based on the selected calculation type, scale, and optionally selected labels.
Change a Calculation Type
You can change the calculation type of an assigned metric by editing its entry under Assigned Cost Reports. Because a report can use only one calculation type at a time, you can only change a metric’s calculation type if it is the sole business metric on that report. If the report has other business metrics assigned, remove them before changing the calculation type.Assign via the API or Terraform
You can assign a business metric to a Cost Report and set its calculation type programmatically. When creating or updating a business metric with the/business_metrics endpoint, include the calculation_type field (unit_cost, usage_unit_cost, gross_margin, or raw_business_metric) alongside unit_scale and either label_filter (single-label metrics) or label_filters (a map of label column to values for multi-column metrics) on each Cost Report token. To retrieve the calculated values for a report, use the GET /unit_costs endpoint. The same assignment can be managed in Terraform with the vantage_business_metric resource.
Forecasted Metrics
Dynamic forecasting is available to Enterprise customers only.
Dynamic Forecasts are a distinct forecast type from forecasts built with Scenario Models, which model known future costs, credits, or trends and are applied to a Cost Report as Scenario Model forecasts. See the Forecasting overview for a comparison of all three forecast types.
1
Create a business metric
Follow the steps in the Import Business Metrics section above if you haven’t created a business metric yet.
2
Upload forecasted metrics
Once you’ve uploaded historical costs, select the Forecasted Metrics tab.Only data uploaded to the Forecasted Metrics tab will be used for Dynamic Forecasting. Upload a CSV file with your projected metrics, use the Vantage API, or import them from a connected integration using the same steps as historical metrics. Use the same CSV format as historical data, including multiple named label columns when needed. Label filters configured on the assigned Cost Report also apply to forecasted values when the forecasted data uses the same label structure. For example:
3
Assign to a Cost Report
Assign the business metric to a Cost Report if you haven’t already. See the Assign Business Metrics to Cost Reports section for details.
4
View and manage your forecast
Review the Forecasting documentation to learn how to view your Dynamic Forecast on Cost Reports and compare forecast types.
View Business Metrics on Cost Reports
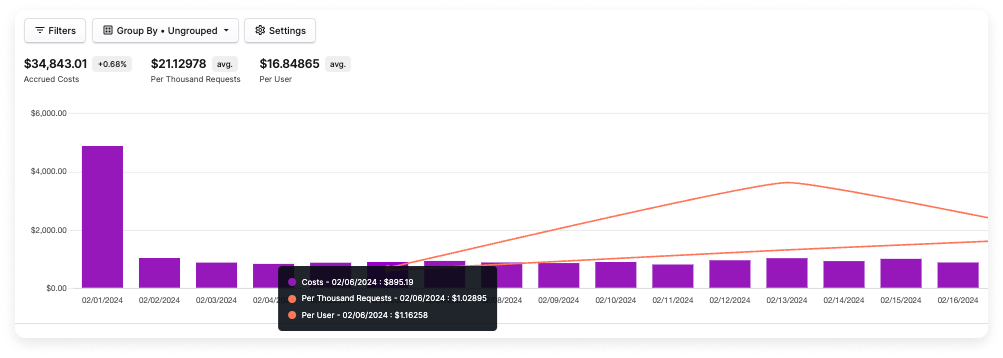
- Unit Cost and Usage Unit Cost display the per-unit value, and the average for the selected date range is displayed at the top of the screen. This average is calculated by first binning business metrics according to the selected date bucket (day, week, or month), then dividing the total costs (or usage) by the total binned business metrics for date bins where both values are available. This ensures accurate results that respect the date bucket size used by the report.
- Gross Margin displays the margin percentage over the selected date range.
- Raw Value displays the metric value as-is, making it easy to correlate the metric against spend.