

Enrichment Runs Table
The table lists one row for each combination of provider cost integration (a connected provider account, such as a single OpenAI project or AWS account) and billing period that ran enrichment. Rows are ordered by the most recent run first. When a billing period is enriched more than once, only the latest run for that period appears. Re-enrichment replaces the row rather than adding a new one.
Lifecycle changes appear as their own rows, mixed in with the runs by date: Added when enrichment is first enabled for an integration, and Paused or Resumed when you stop, disable, resume, or re-enable it. These rows record an event rather than a run, so they have no billing period and show
- in all three percentage columns.
If the table shows an Import history unavailable alert, the page could not load the history data. Select Retry. If the table is empty and shows No data available., no enrichment run has recorded a result for this source yet; this is expected until the provider’s next data refresh completes.
Status Values
Each row records a run that has already finished, so you will not see in-progress states like Pending or Importing here. Those describe the source as a whole and appear on the sources table on the integration page.
One message can appear in red beneath the status badge:
Multiple cost integrations share this bucket and the logs have no resource_account_id. More than one cost integration for the same provider reads from this bucket, and your log records do not say which account each request belongs to. Vantage withholds that usage rather than attributing it to the wrong account. Add resource_account_id to your records, or point each integration at its own bucket.
Reading the Three Percentages
The three percentages (Log Lines Kept, Tokens Kept, and Bill Match) look similar but measure different things at different stages, so a low number in one column tells you something very different from a low number in another. In short, Log Lines Kept is about your logs, while Tokens Kept and Bill Match are about matching those logs to the bill. Enrichment brings two streams together, the usage in your logs and the cost rows on your provider bill, and each arrow below is labeled with the percentage that measures that step:
A few things to keep in mind when you read these numbers:
- Bill Match is calculated for the entire cost import: If more than one enrichment source feeds the same cost integration, they share the same Bill Match value.
- Tokens Kept and Log Lines Kept are not comparable to each other: One counts tokens after the join, the other counts log lines before it. It is normal to see a high Log Lines Kept alongside a lower Tokens Kept.
- A low percentage does not change your totals: usage Vantage cannot attribute stays on a leftover row, the unallocated remainder of the original cost row, so the enriched rows always add back up to what the provider billed.
For the current month, the two most recent days are left out of these percentages (and out of the Token Metrics behind them). Vantage usually receives your logs before your provider’s bill for the same day arrives, so it waits about two days for the bill to catch up. Scoring those days early would make the numbers look artificially low. Finished months are not affected.
Token Metrics: Log Scan and Join
Select the Tokens Kept percentage on any run to open the Token Metrics screen.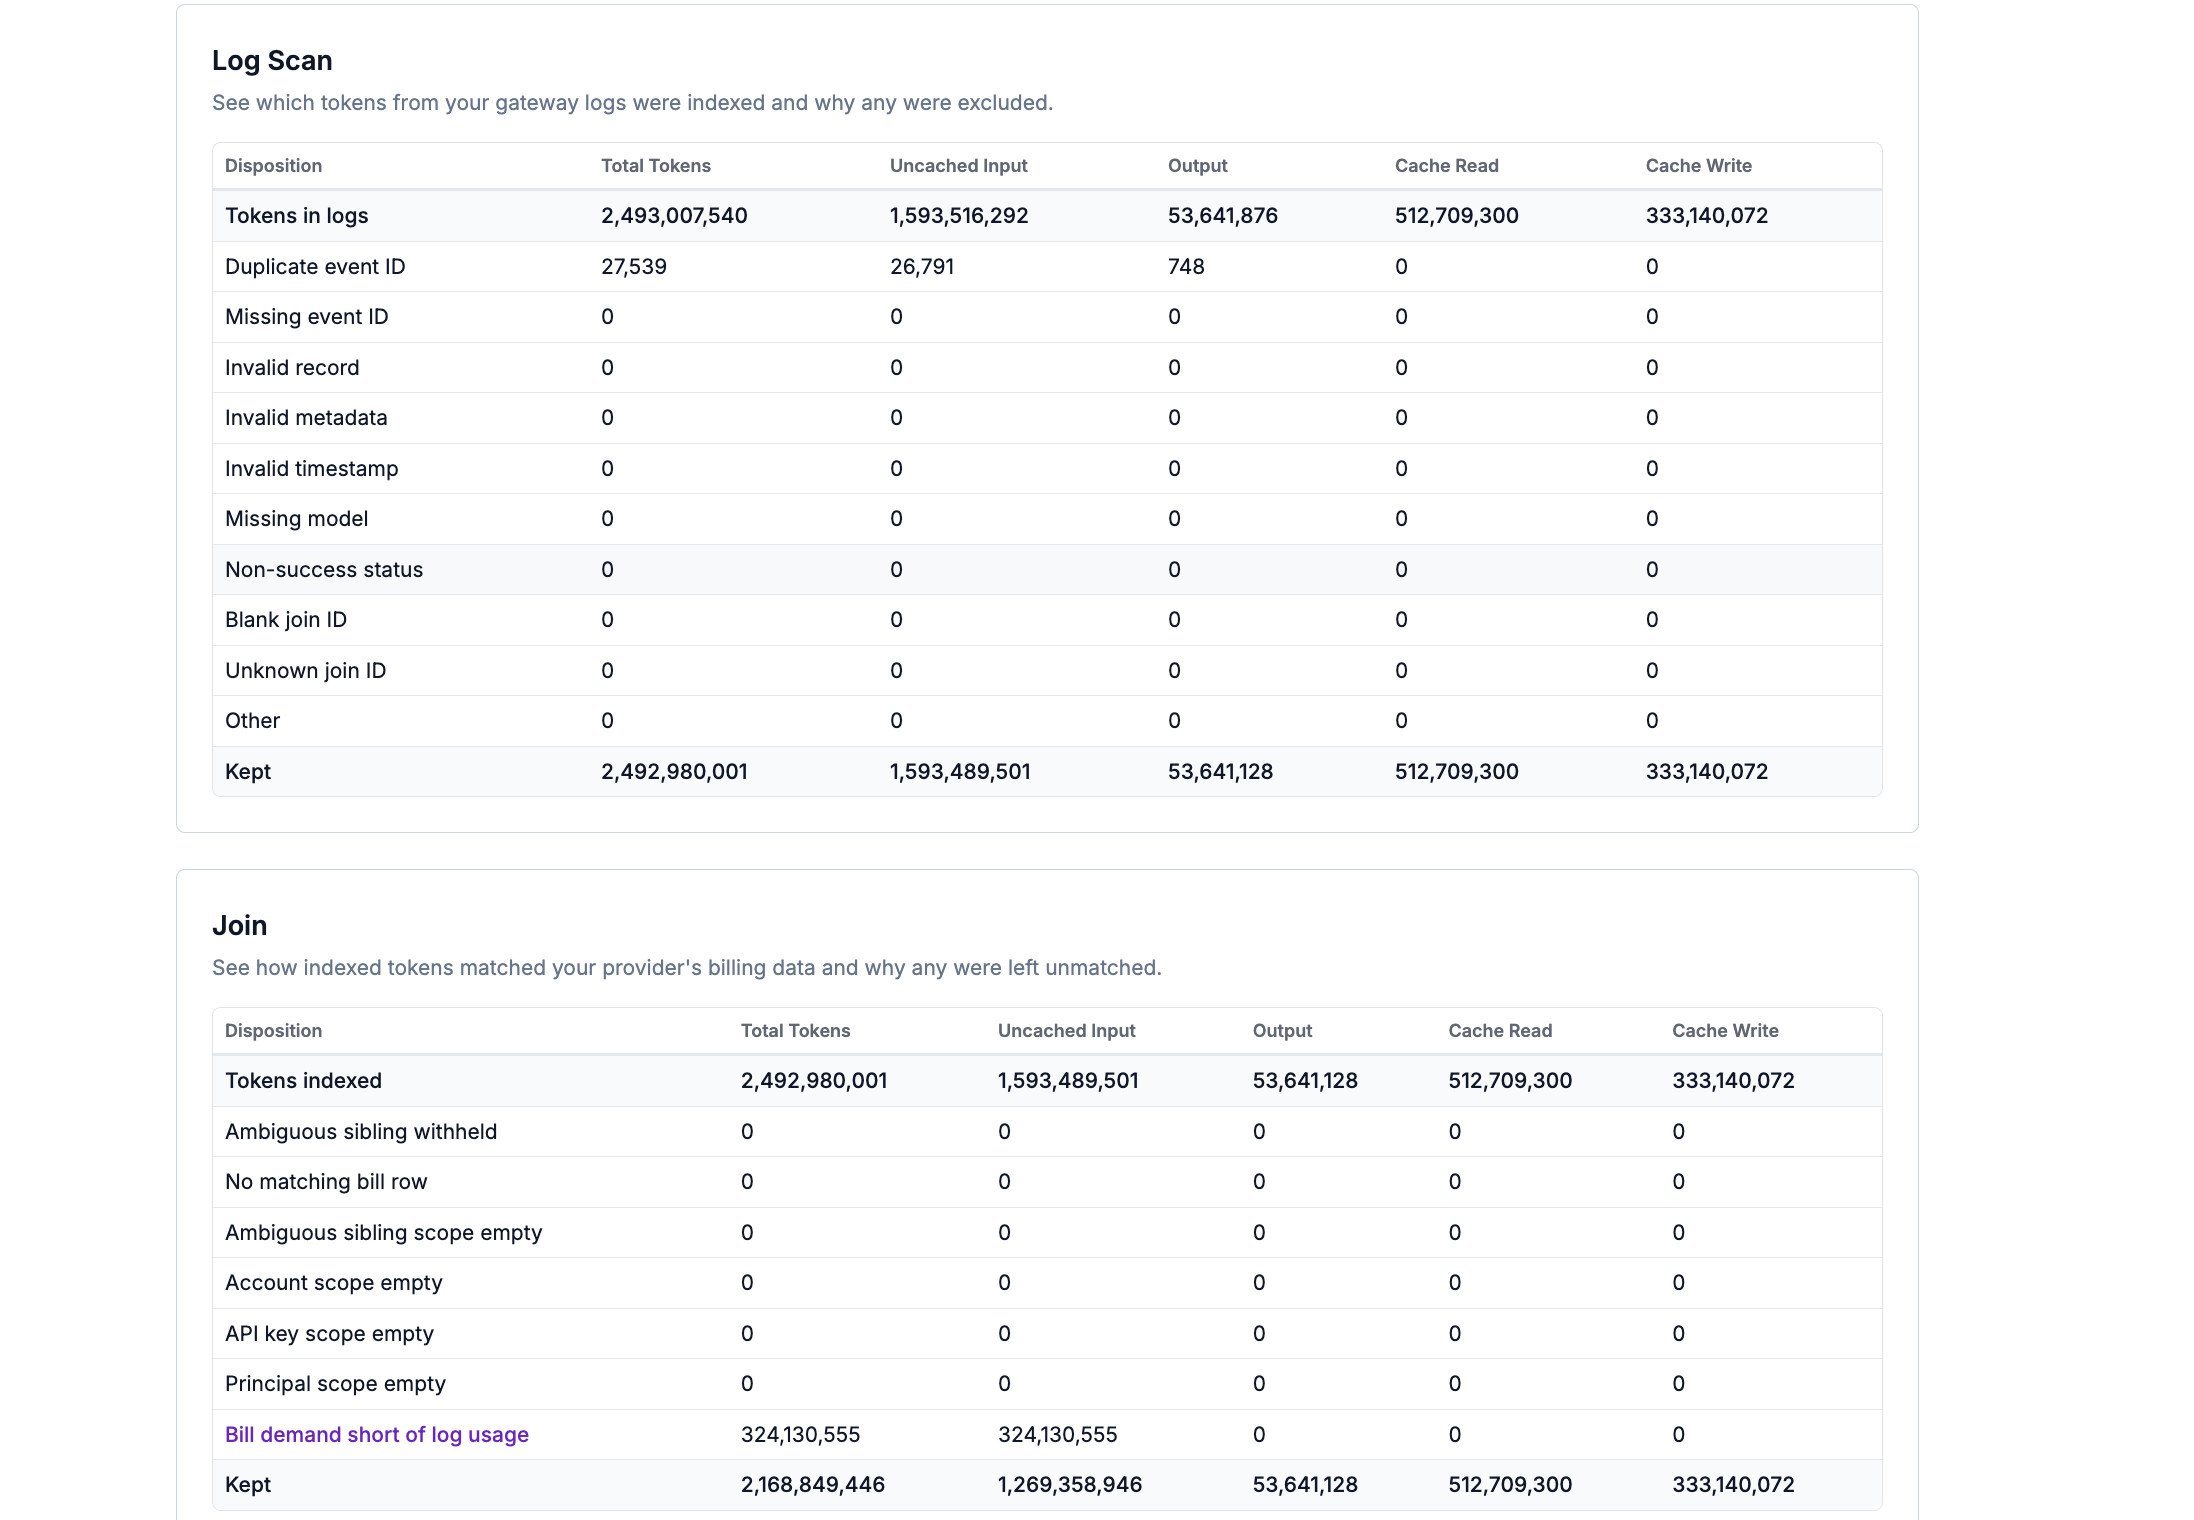
Each section starts with a shaded total row and ends with a shaded Kept row. Everything between them is usage that did not make it through that stage. Read a section top to bottom: the total at the top, the reasons in the middle, and what survived at the bottom.
In both tables, any reason row that carried tokens is a link. Select it to open sample records: up to 25 real examples of the affected requests, which are the fastest way to see what actually went wrong. The shaded total rows are never links, and neither are Duplicate event ID or Missing event ID, which Vantage does not keep samples for.
Log Scan Dispositions
Log Scan covers reading your log files and building the usage index. It starts from Tokens in logs, the total Vantage read for the period, and ends at Kept, the tokens handed to the join.Join Dispositions
Join covers matching indexed usage to your provider’s cost rows. It starts from Tokens indexed, which equals the Kept value from Log Scan, and ends at Kept, the tokens that were allocated onto cost rows. Each disposition names the point where matching stopped. Vantage first matches on the model and token kind, then narrows the result by account, API key, and calling identity.Unmatched tokens do not change your totals. Whatever portion of a cost row your logs did not account for stays on a leftover row, which keeps the provider’s existing tags but none of your enrichment tags, so the enriched rows always add back up to the original cost row to the cent.
View Sample Records
Where a disposition name appears as a link, select it to open a dialog with up to 25 sample records for that disposition.- Samples from Log Scan section: Show the log record as Vantage read it, with your custom tags removed, plus the reason it was not indexed. Compare a sample to a record you expect to work and look for the missing or malformed field.
- Samples from Join section: Always name the
modelandusage_kindthat went unmatched, and most dispositions add the fields described below. Bill demand short of log usage is the exception and shows onlymodelandusage_kind, because nothing failed to match: the bill simply ran out of usage to attach.
Log Scan sample: unknown join ID
stage is not_joined, matched_on is empty because matching stopped at the very first comparison, and failed_on names the model as the reason.
Join sample: no matching bill row
not_matched stage, failed_on_log_values shows the account identifier your logs actually carried, which you can compare against the account on the connected cost integration.
Join sample: account scope empty
stage, matched_on, or failed_on. The record names only the model and token kind that had surplus tokens. This is expected, not an error.
Join sample: bill demand short of log usage
For a No matching bill row record,
failed_on narrows the cause considerably:
failed_on: "model"means your bill has no cost row for that model at all. Check whether the provider bills it under a different name, or whether the tier encoded in the join key matches a tier the provider actually bills.failed_on: "usage_kind"means the model is on your bill, but not for that token kind. This is common for cache tokens on models where the provider does not itemize caching separately.
- The shaded summary rows: Tokens in logs, Tokens indexed, and Kept are totals rather than problems, so there is nothing to sample.
- Duplicate event ID and Missing event ID: Vantage does not retain sample records for these two, so they are never links even when they carry tokens.
- Any disposition with zero tokens: There is nothing to show.
No examples were recorded for this disposition., no samples were captured for it during that run. Examples could not be loaded. Try again. means the samples could not be fetched; reopen the dialog to retry.
Join Key Format
In join samples,model is the join key, not just a model name. It packs together every dimension that both sides must agree on before usage can attach to a cost row, so it can look unfamiliar at first.
- For AWS Bedrock, the key is
region|operation|inference_scope|tier|model, and*means “any value.” So*|*|*|standard|openai.gpt-5.6-lunareads as: the modelopenai.gpt-5.6-luna, at standard (non-batch) tier, with no Region, operation, or inference profile reported by the logs, so any of those on the bill can match. - For OpenAI, the key is
tier:model, ortier:regional:modelfor regional-endpoint traffic. Sodefault:gpt-4oisgpt-4oon the default service tier.
Troubleshoot Using Import History
Use this table to turn what you see on the screen into a next step.Provider-Specific Troubleshooting
For setup and permission error messages, and for the case where costs are not split at all, see the Troubleshooting section on your integration’s page.
Custom LLM Enrichment
Troubleshooting for common-schema telemetry sources.

Cloudflare AI Gateway
Troubleshooting for Cloudflare AI Gateway Logpush sources.

AWS Bedrock
Troubleshooting for Model Invocation Log sources.

LiteLLM
Troubleshooting for LiteLLM collector sources.