Forecasting
For every Cost Report, Vantage generates a forecast that projects where your costs are expected to be by the end of the current month. You can also view projected costs, several months ahead. Vantage uses a time-series model to generate these forecasts and will run through all available data ingested into the platform on a per-service basis (e.g., EC2, RDS). These costs are forecasted into the future, taking into account seasonality or one-off spikes.
View a Forecast on a Cost Report
To view a forecast on a Cost Report, create a new Cost Report and save it. After you create a new Cost Report, a message is displayed that indicates the forecast is generating. The processing time depends on the amount of data contained in the filtered report, but it usually takes less than 10 minutes.
The forecast for the rest of the current month is displayed, by default, on the chart. Forecasts are available on line charts and bar charts. On line charts, forecasts are available for all date binning options. For bar charts, you can view forecasts for day, week, and month date binnings.
The forecast includes an upper-expected band and a lower-expected band, with a median forecast that is in the middle of these two ranges. This forecast is updated daily as new cost data arrives.
To view a future forecast, open the date picker to the top right of the chart.
- On the left, under Forecast Periods, select either Next Month, Next 3 Months, or Next 6 Months.
- Click Apply. Change to either the bar or line chart view to see a forecast.
Bar Chart View
In the below example image, bars for future months are visible. Error bars are present for future months to represent the upper and lower bounds of the forecast. Hover over any future date to see the forecasted min, max, and median. Total forecasted costs are displayed above the chart, next to currently accrued costs.
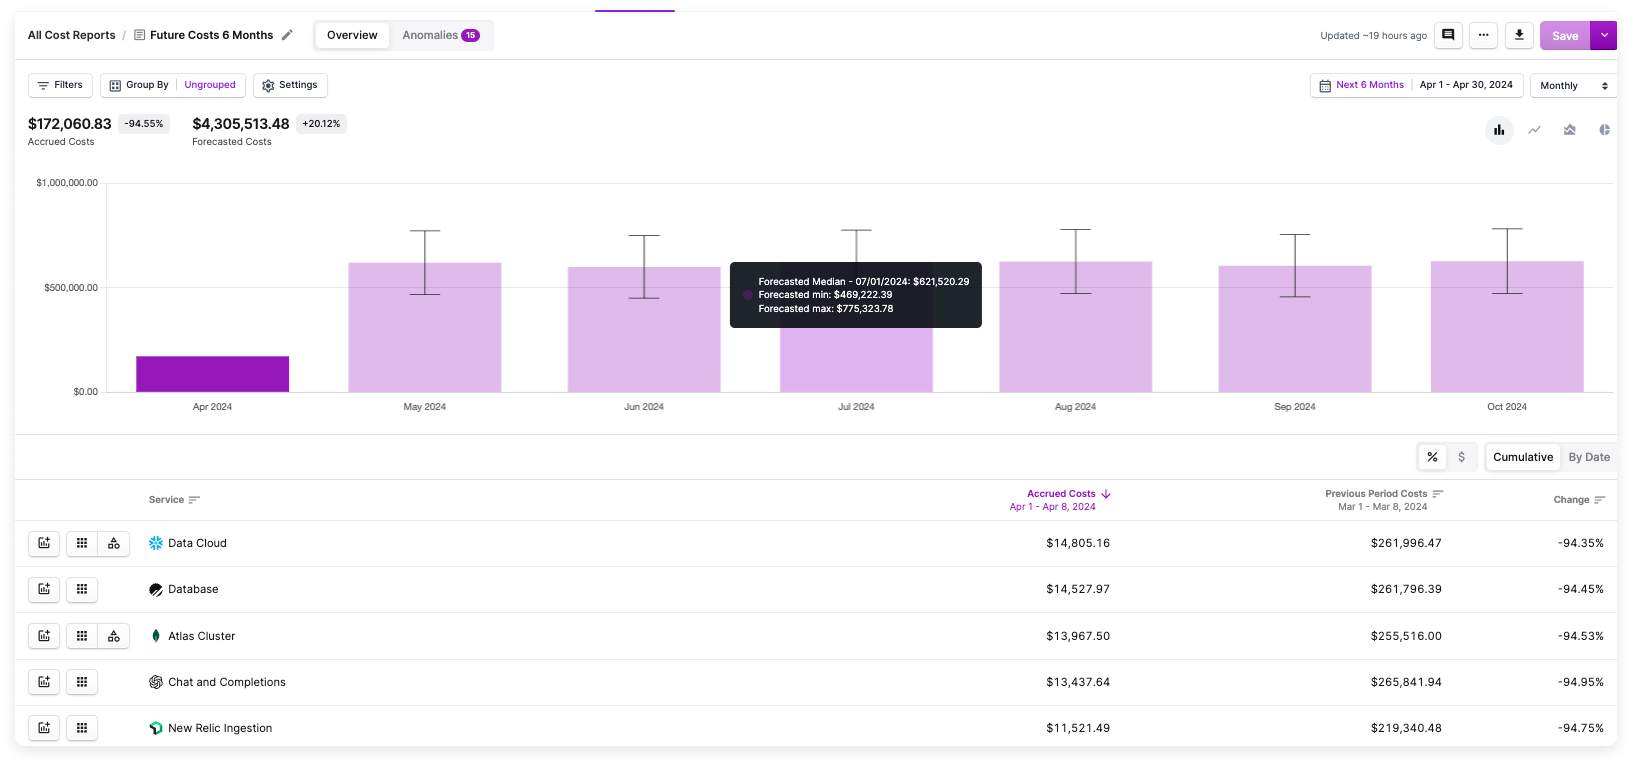
Forecasts are also present in grouped bar charts.
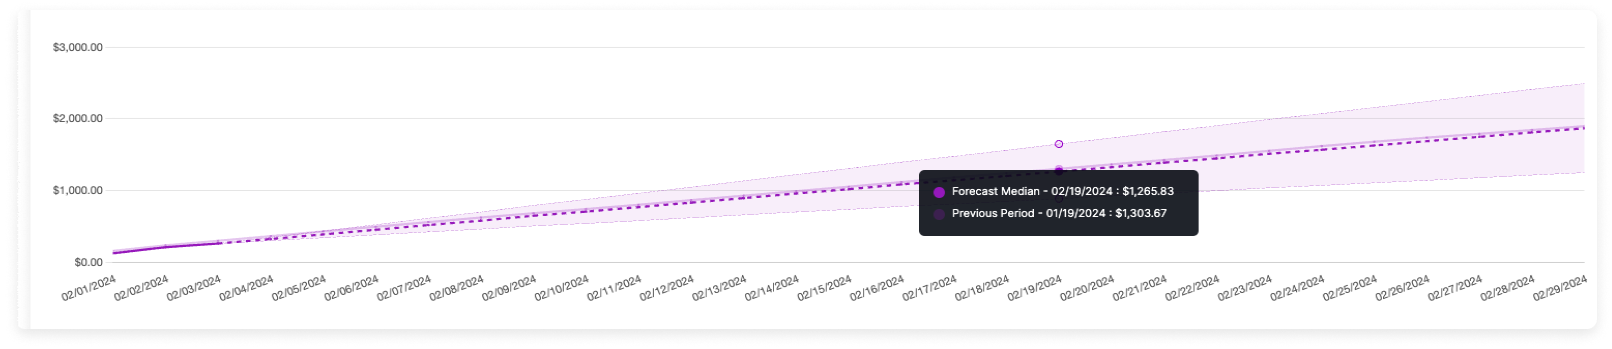
Line Chart View
In the below example image, the light-purple area is the forecast range, with upper and lower bounds. The dark-purple dotted line represents the median forecast for that month. Hover over any future date to see the forecast median and the previous period's costs. Total forecasted costs are displayed above the chart, next to currently accrued costs.
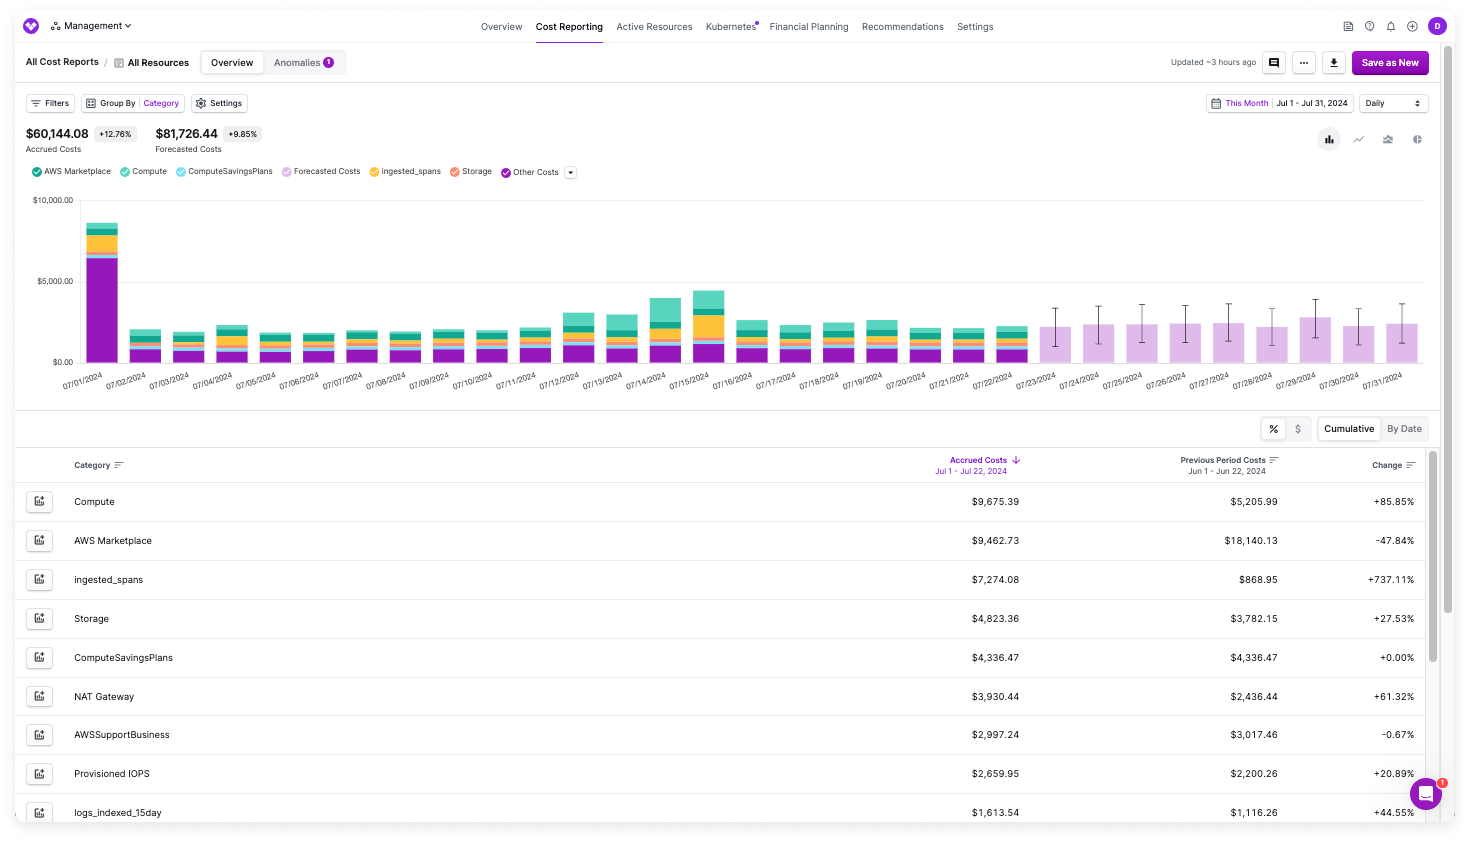
View Service Forecasts
In addition to aggregate forecasts on Cost Reports, you can also view a per-service cost forecast. On any Cost Report, select a row from the table. An individual forecast is displayed for the selected service.