> ## Documentation Index
> Fetch the complete documentation index at: https://docs.vantage.sh/llms.txt
> Use this file to discover all available pages before exploring further.

# Hands-On Demo

> Interactive demo to practice using Vantage features in a real-world scenario.

This interactive demo brings together everything you've learned in Vantage University. Work through a realistic FinOps scenario to build a basic reporting structure for management using multiple Vantage features.

## Demo Scenario

You're the FinOps Analyst at TechFlow SaaS, a fast-growing company where cloud costs have been increasing. Leadership wants visibility into spending patterns and a clear view of where costs are going.

<Columns cols={2}>
  <Card title="Your Mission" icon="building">
    Build a comprehensive reporting structure for management that provides visibility into cloud spending, cost allocation, and optimization opportunities.
  </Card>

  <Card title="What You'll Build" icon="hammer">
    Build an Executive Dashboard using Cost Reports, Virtual Tags, and Resource Reports to provide complete visibility for leadership decision-making.
  </Card>
</Columns>

***

## Demo Walkthrough

Follow along with this step-by-step walkthrough. Each step includes an interactive demo to practice the concepts.

<Tip>
  For the most seamless experience in this interactive demo, we recommend using a desktop or laptop device. Some features and embedded demos may not display or function properly on mobile devices.
</Tip>

### Step 1: Create Your First Cost Report

Start by creating a basic Cost Report to understand your overall cloud spending. Create a Cost Report that shows costs by provider for the past month, displayed as a pie chart.

<Frame>
  <div style={{position:'relative',width:'100%',aspectRatio:'16/9',borderRadius:'12px',overflow:'hidden'}}>
    <img src="https://mintcdn.com/vantage-39/hsISZqda4u36vuo9/samples/dashboard-executive-overview-2.png?fit=max&auto=format&n=hsISZqda4u36vuo9&q=85&s=b08a117cba626a7da4e297b9c0b23cf5" alt="Step 1: Create Cost Report by Provider" style={{width:'100%',height:'100%',objectFit:'cover'}} width="792" height="612" data-path="samples/dashboard-executive-overview-2.png" />

    <div
      style={{
position:'absolute',
top:0,
left:0,
right:0,
bottom:0,
backdropFilter:'blur(2px)',
backgroundColor:'rgba(255,255,255,0.1)',
display:'flex',
alignItems:'center',
justifyContent:'center'
}}
    >
      <button
        onClick={(e) => {
e.preventDefault();
if(typeof NavatticEmbed !== 'undefined' && NavatticEmbed.open) {
  NavatticEmbed.open('https://capture.navattic.com/cmkpqhpvk000104l202yufa2q', 'Create a Cost Report');
} else {
  window.open('https://capture.navattic.com/cmkpqhpvk000104l202yufa2q', '_blank', 'width=1200,height=800');
}
}}
        style={{
padding:'16px 32px',
backgroundColor:'#6742D6',
color:'white',
border:'none',
borderRadius:'8px',
cursor:'pointer',
fontSize:'18px',
fontWeight:'600',
boxShadow:'0 4px 12px rgba(103, 66, 214, 0.4)',
transition:'all 0.2s ease',
zIndex:10
}}
        onMouseEnter={(e) => {
e.currentTarget.style.transform = 'scale(1.05)';
e.currentTarget.style.boxShadow = '0 6px 16px rgba(103, 66, 214, 0.5)';
}}
        onMouseLeave={(e) => {
e.currentTarget.style.transform = 'scale(1)';
e.currentTarget.style.boxShadow = '0 4px 12px rgba(103, 66, 214, 0.4)';
}}
        onFocus={(e) => {
e.currentTarget.style.transform = 'scale(1.05)';
e.currentTarget.style.boxShadow = '0 6px 16px rgba(103, 66, 214, 0.5)';
}}
        onBlur={(e) => {
e.currentTarget.style.transform = 'scale(1)';
e.currentTarget.style.boxShadow = '0 4px 12px rgba(103, 66, 214, 0.4)';
}}
      >
        Click to start demo <span style={{color:'white',display:'inline-block',verticalAlign:'text-bottom',marginLeft:'4px'}}><Icon icon="external-link" size={16} color="white" /></span>
      </button>
    </div>
  </div>
</Frame>

***

### Step 2: Set Up Cost Allocation with Virtual Tags

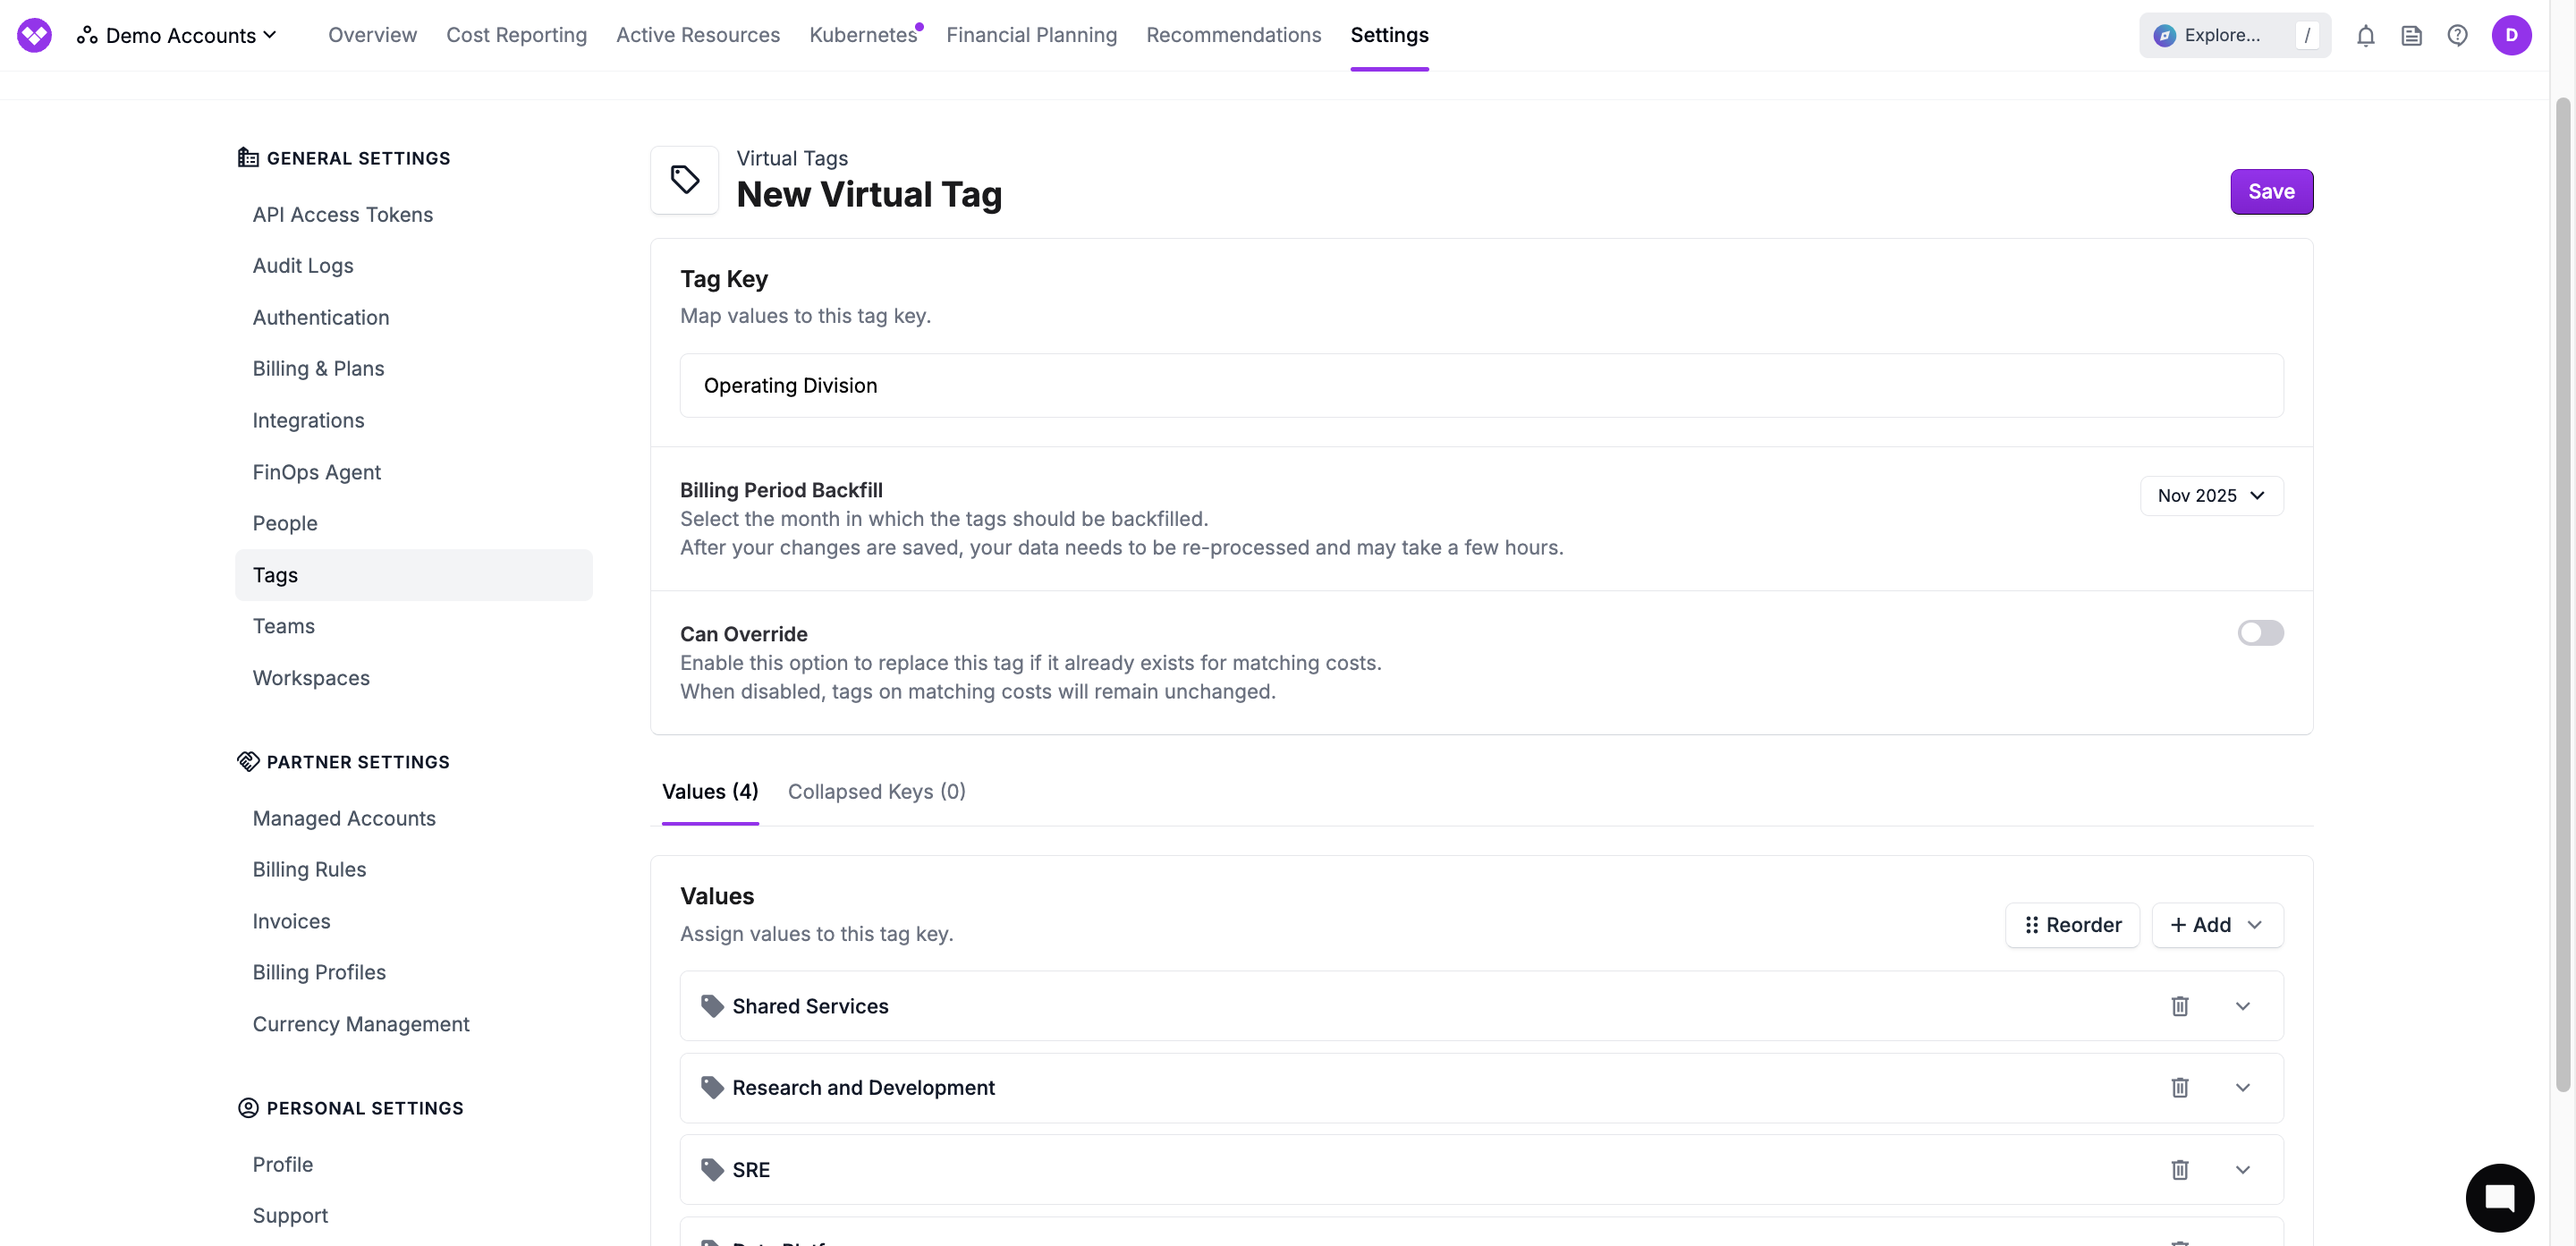
This section includes two parts. First, you'll create a virtual tag to allocate costs back to different operating divisions. After you complete the tag creation, you can continue directly in the demo to create a Cost Report filtered by that division tag. This will help you understand how costs are distributed across your organization.

<Frame>
  <div style={{position:'relative',width:'100%',aspectRatio:'16/9',borderRadius:'12px',overflow:'hidden'}}>
    <img src="https://mintcdn.com/vantage-39/XgqVgLdLLR-vNkXh/img/tags-preview.png?fit=max&auto=format&n=XgqVgLdLLR-vNkXh&q=85&s=f549bde69b157df802ff2d0976980ab3" alt="Step 2: Set Up Cost Allocation with Virtual Tags" style={{width:'100%',height:'100%',objectFit:'cover'}} width="2880" height="1393" data-path="img/tags-preview.png" />

    <div
      style={{
position:'absolute',
top:0,
left:0,
right:0,
bottom:0,
backdropFilter:'blur(2px)',
backgroundColor:'rgba(255,255,255,0.1)',
display:'flex',
alignItems:'center',
justifyContent:'center'
}}
    >
      <button
        onClick={(e) => {
e.preventDefault();
if(typeof NavatticEmbed !== 'undefined' && NavatticEmbed.open) {
  NavatticEmbed.open('https://capture.navattic.com/cmkrlwff0000004k1gbvghnrt', 'Set Up Cost Allocation with Virtual Tags');
} else {
  window.open('https://capture.navattic.com/cmkrlwff0000004k1gbvghnrt', '_blank', 'width=1200,height=800');
}
}}
        style={{
padding:'16px 32px',
backgroundColor:'#6742D6',
color:'white',
border:'none',
borderRadius:'8px',
cursor:'pointer',
fontSize:'18px',
fontWeight:'600',
boxShadow:'0 4px 12px rgba(103, 66, 214, 0.4)',
transition:'all 0.2s ease',
zIndex:10
}}
        onMouseEnter={(e) => {
e.currentTarget.style.transform = 'scale(1.05)';
e.currentTarget.style.boxShadow = '0 6px 16px rgba(103, 66, 214, 0.5)';
}}
        onMouseLeave={(e) => {
e.currentTarget.style.transform = 'scale(1)';
e.currentTarget.style.boxShadow = '0 4px 12px rgba(103, 66, 214, 0.4)';
}}
        onFocus={(e) => {
e.currentTarget.style.transform = 'scale(1.05)';
e.currentTarget.style.boxShadow = '0 6px 16px rgba(103, 66, 214, 0.5)';
}}
        onBlur={(e) => {
e.currentTarget.style.transform = 'scale(1)';
e.currentTarget.style.boxShadow = '0 4px 12px rgba(103, 66, 214, 0.4)';
}}
      >
        Click to start demo <span style={{color:'white',display:'inline-block',verticalAlign:'text-bottom',marginLeft:'4px'}}><Icon icon="external-link" size={16} color="white" /></span>
      </button>
    </div>
  </div>
</Frame>

<Tip>
  **Additional Cost Reports to Consider:** While you won't create these in the demo, consider building these reports for your executive dashboard:

  * **3-month forecast:** A forecast report showing predicted costs for the next 3 months
  * **6-month forecast:** A longer-term forecast for strategic planning
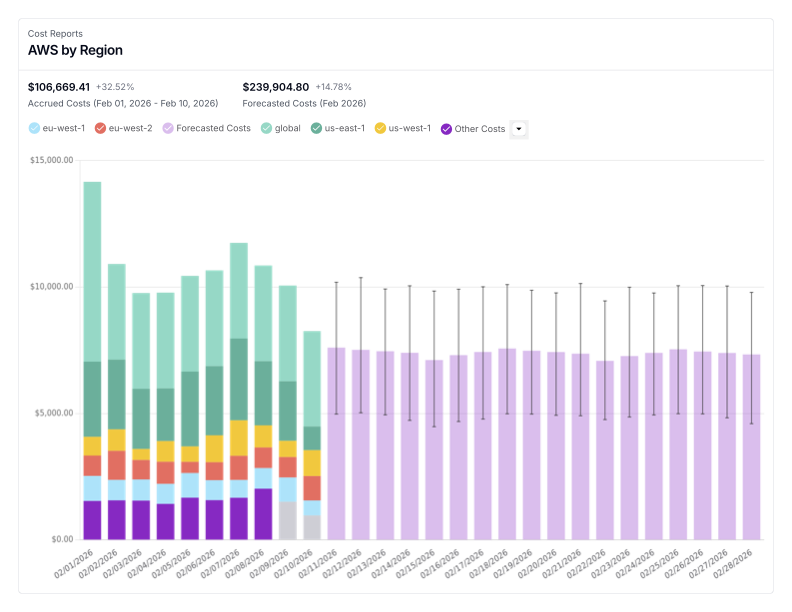
  * **Provider-specific reports:** Create detailed reports for providers like AWS or Azure costs grouped by region to identify geographic spending patterns

  **Default Reports Available:** Vantage also provides default reports that you can add to your dashboard for other features:

  * **All Kubernetes Efficiency Metrics:** The default Kubernetes efficiency report that provides a comprehensive view of all Kubernetes efficiency metrics. See the [Kubernetes documentation](/kubernetes) for more information.
  * **All AWS Financial Commitments:** The default financial commitment report that tracks all AWS Reserved Instances, Savings Plans, and other financial commitments. See the [Financial Commitment Reports documentation](/financial_commitment_reports) for more information.

  These reports will be included in your final dashboard to provide comprehensive visibility.
</Tip>

***

### Step 3: Create a Snowflake Resource Report

Analyze your Snowflake query costs by creating a Resource Report that shows the highest cost queries. This will help identify expensive queries that may need optimization.

<Frame>
  <div style={{position:'relative',width:'100%',aspectRatio:'16/9',borderRadius:'12px',overflow:'hidden'}}>
    <img src="https://app.navattic.com/api/poster/cmkq8eyv9000904k15fb8fuu5" alt="Step 3: Create Snowflake Resource Report" style={{width:'100%',height:'100%',objectFit:'cover'}} />

    <div
      style={{
position:'absolute',
top:0,
left:0,
right:0,
bottom:0,
backdropFilter:'blur(2px)',
backgroundColor:'rgba(255,255,255,0.1)',
display:'flex',
alignItems:'center',
justifyContent:'center'
}}
    >
      <button
        onClick={(e) => {
e.preventDefault();
if(typeof NavatticEmbed !== 'undefined' && NavatticEmbed.open) {
  NavatticEmbed.open('https://capture.navattic.com/cmkq8eyv9000904k15fb8fuu5', 'Create a Snowflake Resource Report');
} else {
  window.open('https://capture.navattic.com/cmkq8eyv9000904k15fb8fuu5', '_blank', 'width=1200,height=800');
}
}}
        style={{
padding:'16px 32px',
backgroundColor:'#6742D6',
color:'white',
border:'none',
borderRadius:'8px',
cursor:'pointer',
fontSize:'18px',
fontWeight:'600',
boxShadow:'0 4px 12px rgba(103, 66, 214, 0.4)',
transition:'all 0.2s ease',
zIndex:10
}}
        onMouseEnter={(e) => {
e.currentTarget.style.transform = 'scale(1.05)';
e.currentTarget.style.boxShadow = '0 6px 16px rgba(103, 66, 214, 0.5)';
}}
        onMouseLeave={(e) => {
e.currentTarget.style.transform = 'scale(1)';
e.currentTarget.style.boxShadow = '0 4px 12px rgba(103, 66, 214, 0.4)';
}}
        onFocus={(e) => {
e.currentTarget.style.transform = 'scale(1.05)';
e.currentTarget.style.boxShadow = '0 6px 16px rgba(103, 66, 214, 0.5)';
}}
        onBlur={(e) => {
e.currentTarget.style.transform = 'scale(1)';
e.currentTarget.style.boxShadow = '0 4px 12px rgba(103, 66, 214, 0.4)';
}}
      >
        Click to start demo <span style={{color:'white',display:'inline-block',verticalAlign:'text-bottom',marginLeft:'4px'}}><Icon icon="external-link" size={16} color="white" /></span>
      </button>
    </div>
  </div>
</Frame>

***

### Step 4: Build Your Executive Dashboard

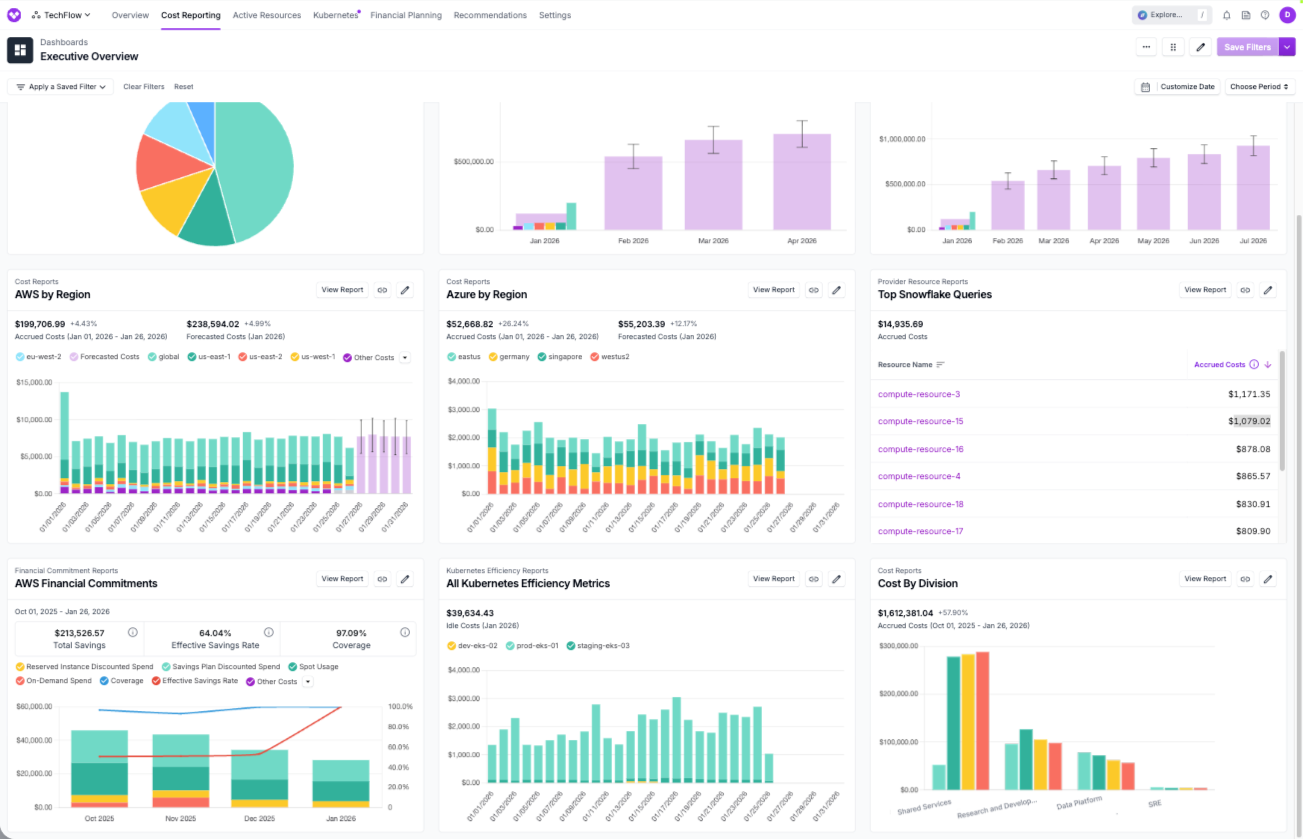
Bring everything together by creating an executive dashboard. Add all the reports you created throughout this demo to provide comprehensive visibility into your cloud spending, cost allocation, optimization opportunities, and financial commitments.

<Frame>
  <div style={{position:'relative',width:'100%',aspectRatio:'16/9',borderRadius:'12px',overflow:'hidden'}}>
    <img src="https://mintcdn.com/vantage-39/XgqVgLdLLR-vNkXh/img/dashboard-preview.png?fit=max&auto=format&n=XgqVgLdLLR-vNkXh&q=85&s=e1dbd565f62519d0c43f540165675db5" alt="Step 4: Build Executive Dashboard" style={{width:'100%',height:'100%',objectFit:'cover'}} width="1303" height="839" data-path="img/dashboard-preview.png" />

    <div
      style={{
position:'absolute',
top:0,
left:0,
right:0,
bottom:0,
backdropFilter:'blur(2px)',
backgroundColor:'rgba(255,255,255,0.1)',
display:'flex',
alignItems:'center',
justifyContent:'center'
}}
    >
      <button
        onClick={(e) => {
e.preventDefault();
if(typeof NavatticEmbed !== 'undefined' && NavatticEmbed.open) {
  NavatticEmbed.open('https://capture.navattic.com/cmkvf6uzw000w04jshsstb226', 'Build Executive Dashboard');
} else {
  window.open('https://capture.navattic.com/cmkvf6uzw000w04jshsstb226', '_blank', 'width=1200,height=800');
}
}}
        style={{
padding:'16px 32px',
backgroundColor:'#6742D6',
color:'white',
border:'none',
borderRadius:'8px',
cursor:'pointer',
fontSize:'18px',
fontWeight:'600',
boxShadow:'0 4px 12px rgba(103, 66, 214, 0.4)',
transition:'all 0.2s ease',
zIndex:10
}}
        onMouseEnter={(e) => {
e.currentTarget.style.transform = 'scale(1.05)';
e.currentTarget.style.boxShadow = '0 6px 16px rgba(103, 66, 214, 0.5)';
}}
        onMouseLeave={(e) => {
e.currentTarget.style.transform = 'scale(1)';
e.currentTarget.style.boxShadow = '0 4px 12px rgba(103, 66, 214, 0.4)';
}}
        onFocus={(e) => {
e.currentTarget.style.transform = 'scale(1.05)';
e.currentTarget.style.boxShadow = '0 6px 16px rgba(103, 66, 214, 0.5)';
}}
        onBlur={(e) => {
e.currentTarget.style.transform = 'scale(1)';
e.currentTarget.style.boxShadow = '0 4px 12px rgba(103, 66, 214, 0.4)';
}}
      >
        Click to start demo <span style={{color:'white',display:'inline-block',verticalAlign:'text-bottom',marginLeft:'4px'}}><Icon icon="external-link" size={16} color="white" /></span>
      </button>
    </div>
  </div>
</Frame>

***

## What You Built

Through this demo, you've created a comprehensive reporting structure for management:

* **Cost Report by Provider and Suggestions for Other Reports** - Overall cloud spending visibility
* **Virtual Tag for Operating Division** - Cost allocation by business unit
* **Snowflake Resource Report** - Analysis of highest cost queries
* **Executive Dashboard** - Unified view combining all reports for leadership

This structure provides the foundation for ongoing FinOps practices and helps drive cost optimization initiatives.

***

## Related Lessons

This interactive demo incorporates concepts from multiple Vantage University lessons. Review the below lessons to deepen your understanding:

<Columns cols={3}>
  <Card title="Cost Reporting" icon="chart-line" href="/vantage_university_cost_reporting" horizontal>
    Learn how to create, filter, and customize Cost Reports.
  </Card>

  <Card title="Cost Allocation" icon="money-bill-1-wave" href="/vantage_university_cost_allocation" horizontal>
    Master virtual tags and cost allocation segments.
  </Card>

  <Card title="Per Resource Costs" icon="server" href="/vantage_university_per_resource_costs" horizontal>
    Analyze individual resource costs and network flows.
  </Card>
</Columns>