> ## Documentation Index
> Fetch the complete documentation index at: https://docs.vantage.sh/llms.txt
> Use this file to discover all available pages before exploring further.
# Virtual Tagging Examples
> Review practical examples for Virtual Tags, allocation tags, time-bound tagging, untaggable AWS resources, and Tag Key Collapsing in Vantage.
Use these examples to design practical tagging workflows in Vantage. The examples show how to standardize existing tags, create Virtual Tags for allocation and ownership changes, handle untaggable resources, and collapse inconsistent tag keys into a cleaner reporting model.
Map provider costs to standardized team, product, or application values.
Allocate shared or fixed costs using cost-based, business metric-based, or percent-based rules.
Model hierarchies and ownership changes without rewriting every report.
Consolidate inconsistent provider tag keys into a single reporting key.
## Custom Values Examples
The following diagram shows how a single Virtual Tag can map provider costs into standardized team values that you can use in Cost Reports.
```mermaid theme={null}
flowchart LR
providerCosts[Provider costs] --> customValueTag["Virtual Tag: Teams"]
customValueTag --> dataTeam["Tag Value: data"]
customValueTag --> mobileTeam["Tag Value: mobile"]
dataTeam --> costReports[Cost Reports]
mobileTeam --> costReports
```
### Example 1 - Cross-Provider Tagging
You want to create a tag mapping for each of your teams that maps corresponding teams with certain services and provider accounts.
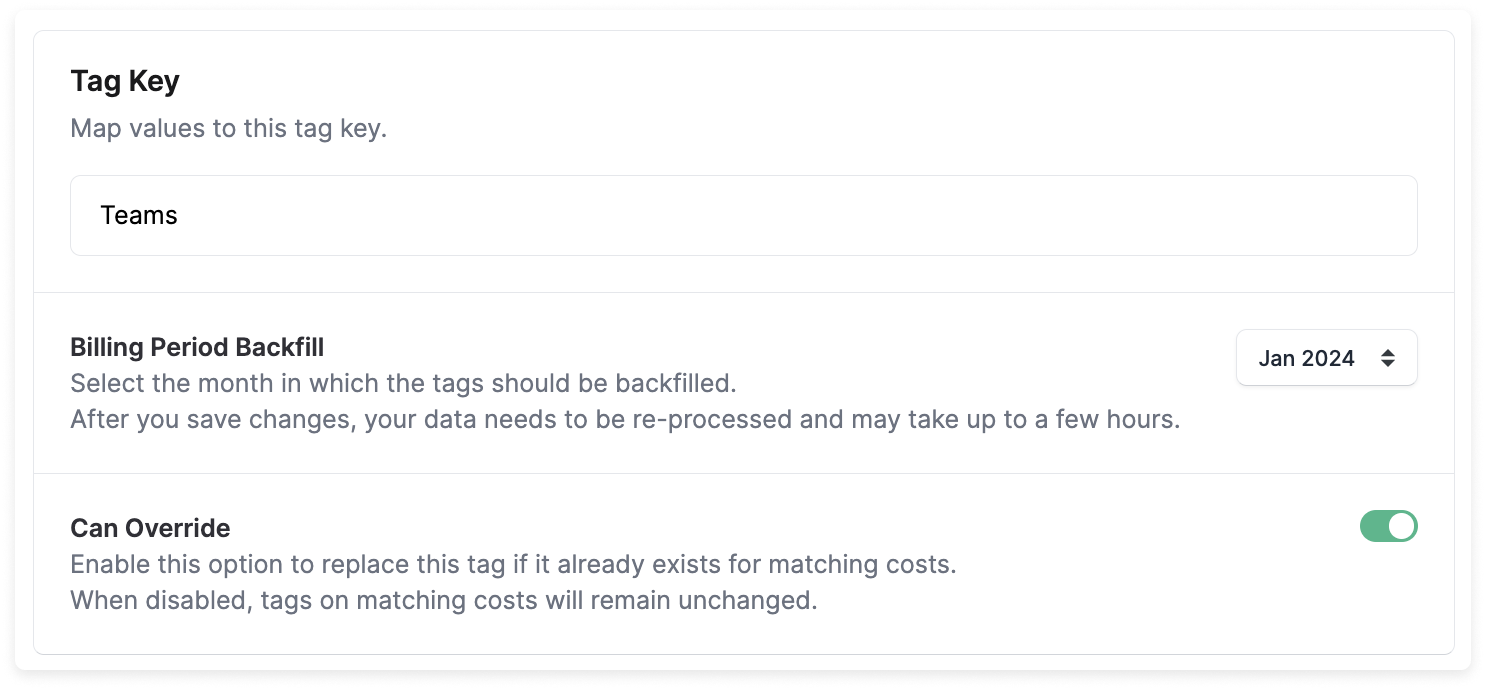
You create a tag key called `Teams`.
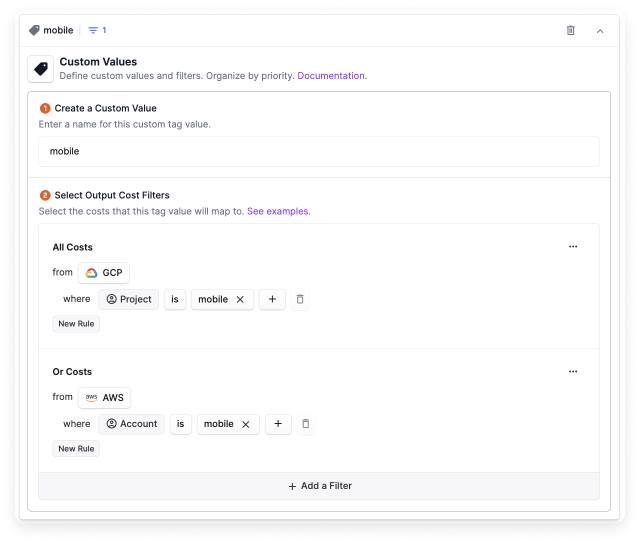
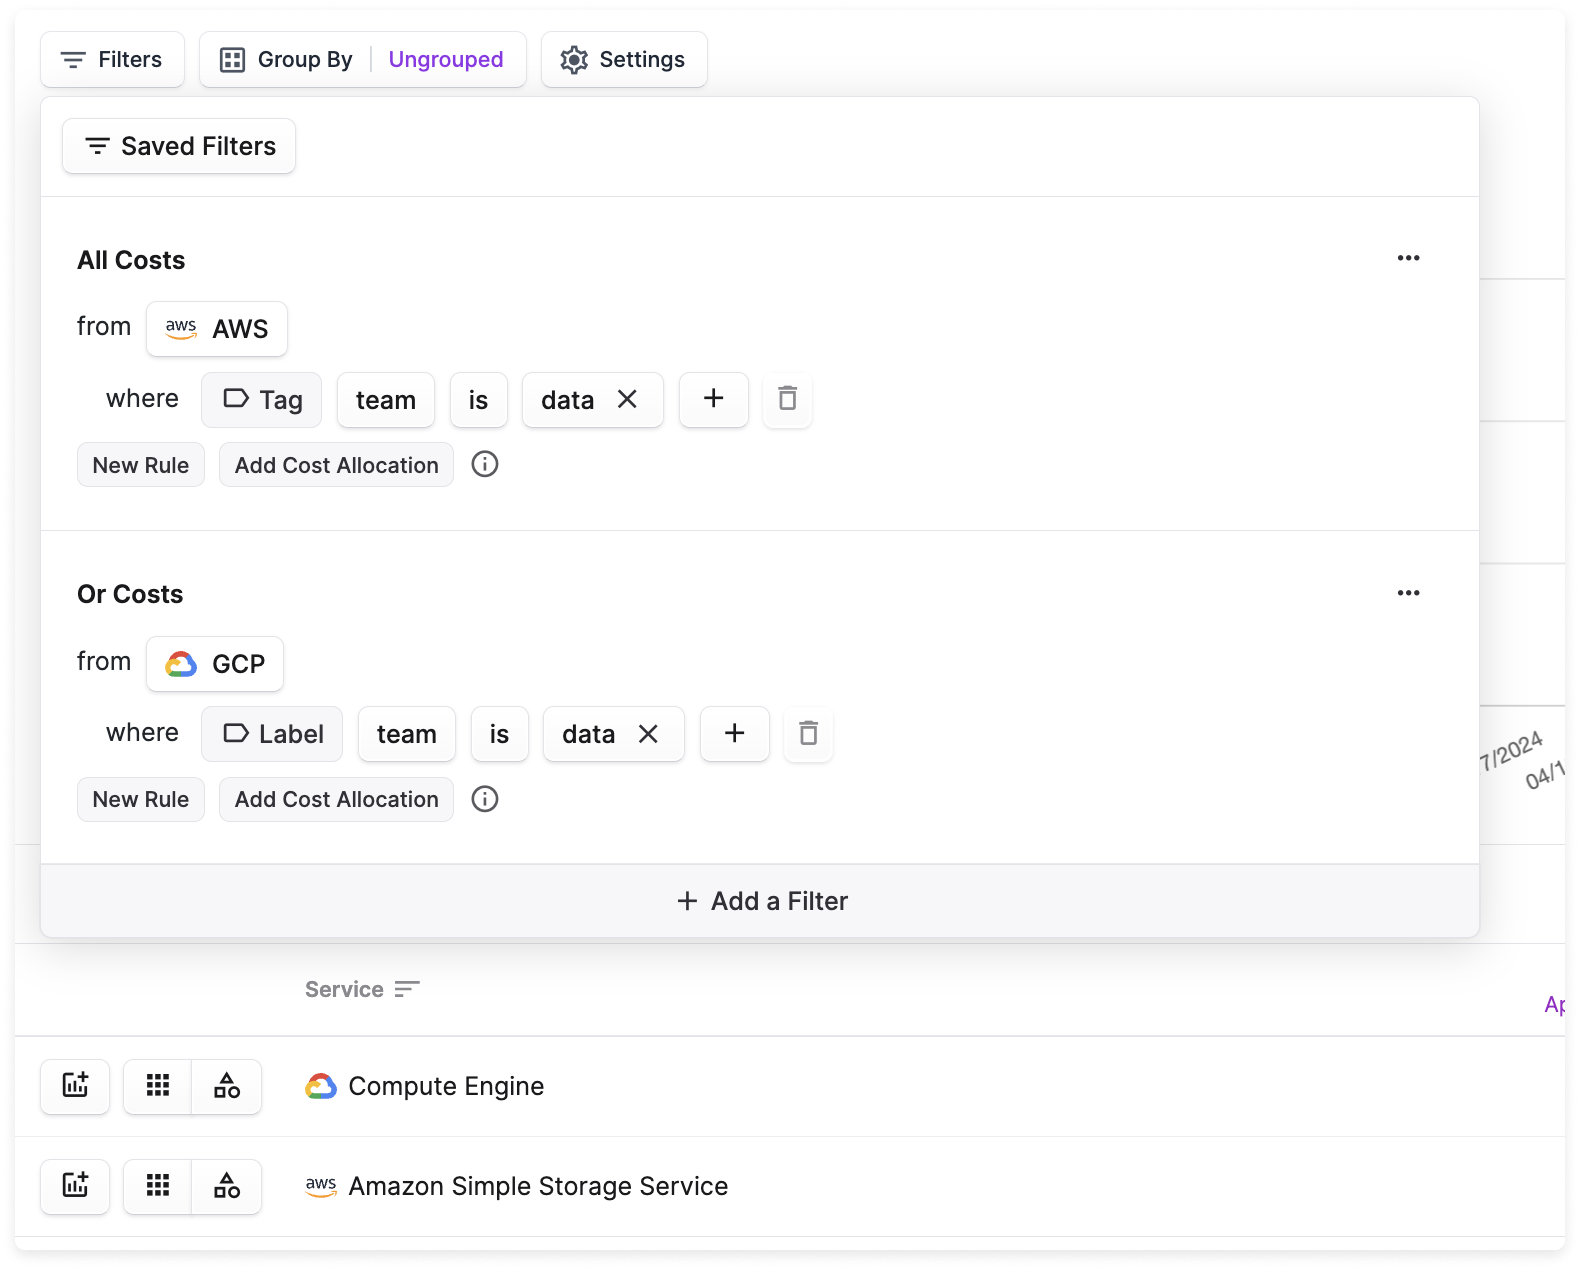
You add the corresponding set of virtual tag values and filters:
* The `data` team tag value corresponds with a filter for all costs for GCP BigQuery and Amazon Redshift.
* The `mobile` team tag value corresponds with a filter for its related GCP projects and AWS accounts.
* You continue this pattern and create similar values with corresponding filters for your other teams.

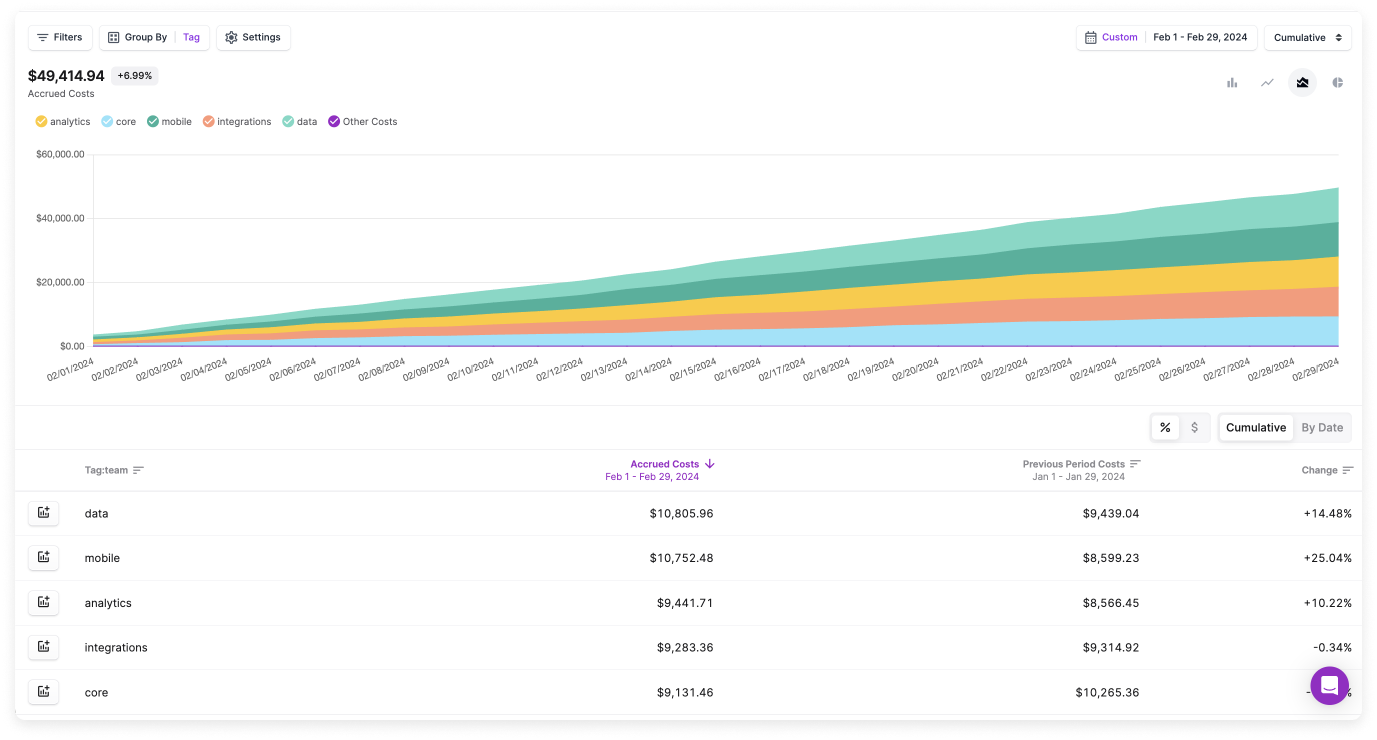
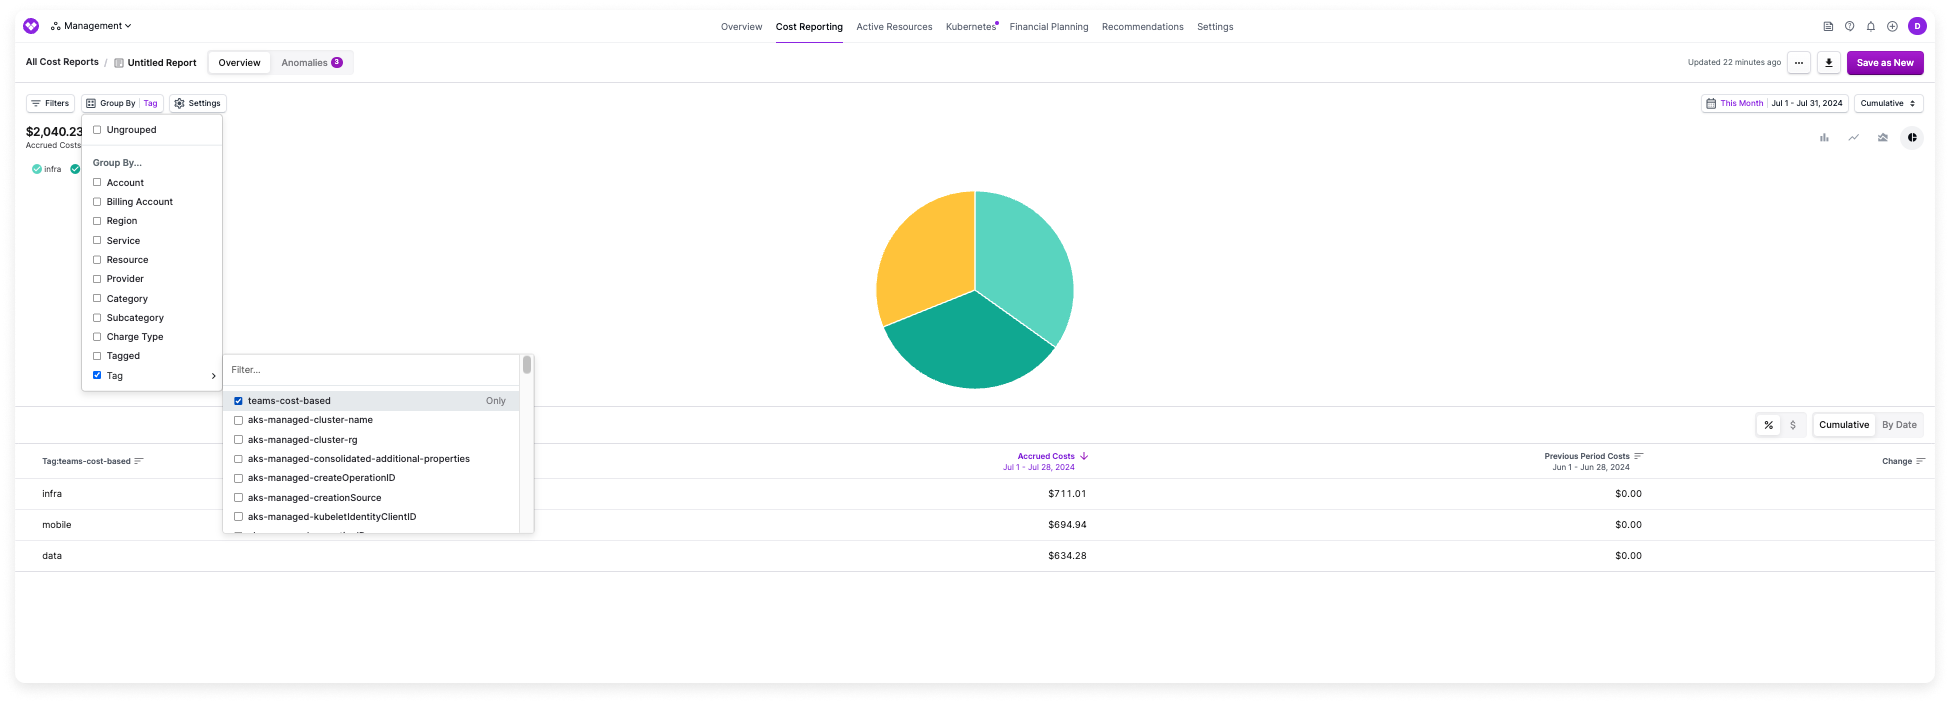
Within Cost Reports, you can filter and group by these tag options to see costs for an individual team. In the following visual example, the Cost Report is grouped by the **team** tag, and the **mobile** and **data** values are displayed along with the other team tag values you created.
If a team's filter logic is the same across every connected provider—for example, every provider tags resources with a `team` key—you can use **All Providers** in the filter set and add a single tag rule (e.g., `Tag team is data`) instead of one rule per provider. See [Best Practices for Filtering Across All Providers](/tagging#best-practices-for-filtering-across-all-providers) before using **All Providers** for high-volume tags.
### Example 2 - Consolidate Existing Tags
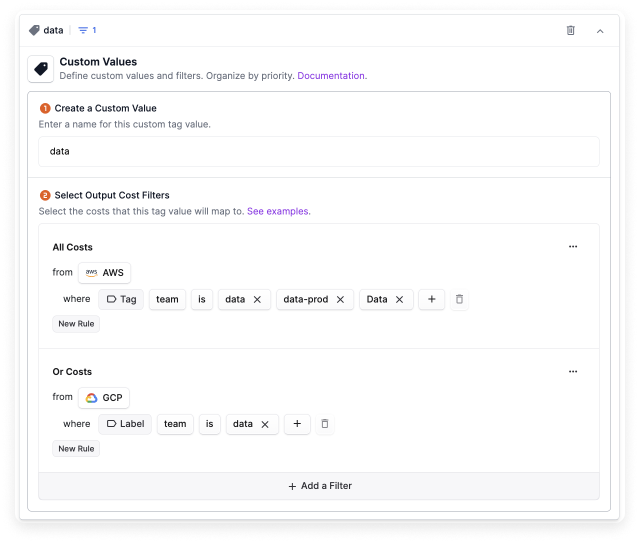
You have a tagging practice established at your organization, but teams often create tags with spelling variations, tags with typos, or they create duplicate tags. For example, the `data` team has resources tagged with `data`, `Data`, and `data-prod`. This is an issue across many of your teams. You want to consolidate all these tags, across providers, into one `data` tag.
You create a tag key called `Teams` to override existing tags.

You add the corresponding set of virtual tag values and filters. In this example, all permutations of the `data` team tag are combined into one virtual tag.
Within Cost Reports, you can filter by this tag to see all costs related to the `data` team. This saves you from repeatedly filtering for every permutation of the tag. You need to filter by only one tag.
### Example 3 - Using Flexible Match to Consolidate Similar Tag Values
Your teams use inconsistent tagging conventions, resulting in multiple variations in casing and formatting. For example, Team A’s tag appears in several forms across usage data, such as `teamA`, `team_a`, `team-a`, and `Team A`. You can use the [flexible match](/cost_reports#flexible-match) filter option to match for all of these variants, as well as future variants, in a single tag configuration.
You create a tag key called `Teams` to override existing tags.

Create a virtual tag configuration for Team A. For the **Output Costs Filter**, use the `Teams` flexible match to the string `Team A`.
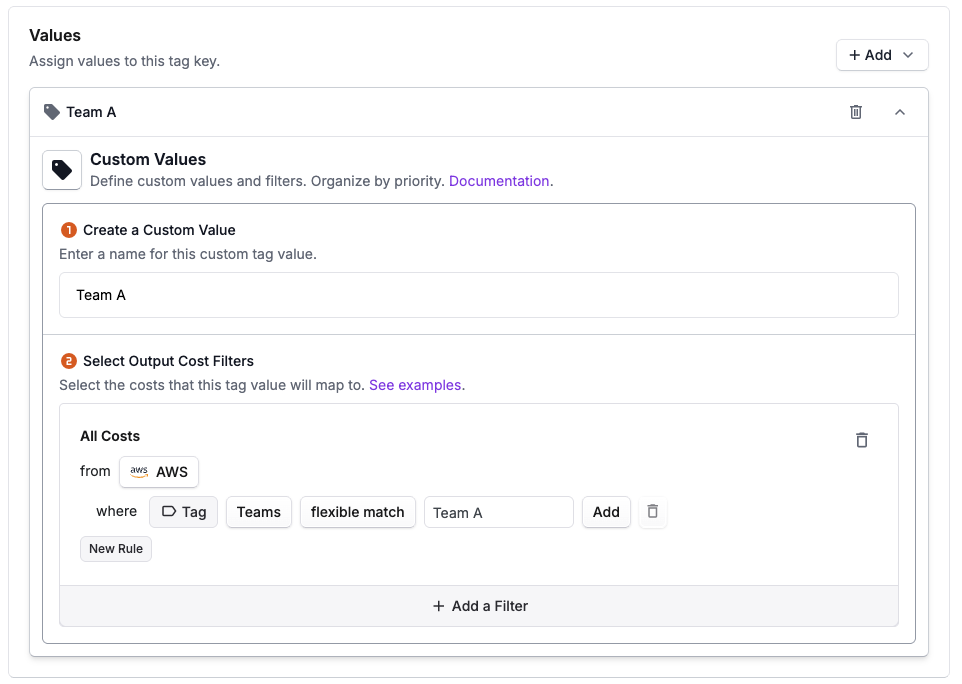
This will automatically match all variants of Team A, such as `teamA`, `team_a`, `team-a`, and `Team A`.
## Cost-Based Allocation Example
In your organization, teams share resources, such as RDS databases or EC2 instances, and each team consumes different percentages of these resources each month. Your organization is also charged a static support fee each month for AWS. As shown in the following diagram, you want to allocate a portion of the support fee to each team based on their proportional use of AWS resources. In this example, since the Infra team is responsible for 50% of all AWS costs, they should also be responsible for 50% of the support fee. You can create a cost-based allocation virtual tag for allocating portions of the support fee to each respective team.
The diagram shows the input AWS usage costs determining how the separate AWS Support cost is distributed across teams.
```mermaid theme={null}
flowchart TD
awsCosts[AWS usage costs] --> infra["Infra: 50 percent"]
awsCosts --> mobile["Mobile: 20 percent"]
awsCosts --> data["Data: 30 percent"]
infra --> supportAllocation[AWS Support cost allocation]
mobile --> supportAllocation
data --> supportAllocation
supportAllocation --> infraSupport[Infra receives 50 percent of support costs]
supportAllocation --> mobileSupport[Mobile receives 20 percent of support costs]
supportAllocation --> dataSupport[Data receives 30 percent of support costs]
```
You have an existing provider tag in AWS that identifies resources for your teams. This tag will be used in the next step.
* Navigate to **Settings > Tags**.
* Create a new virtual tag.
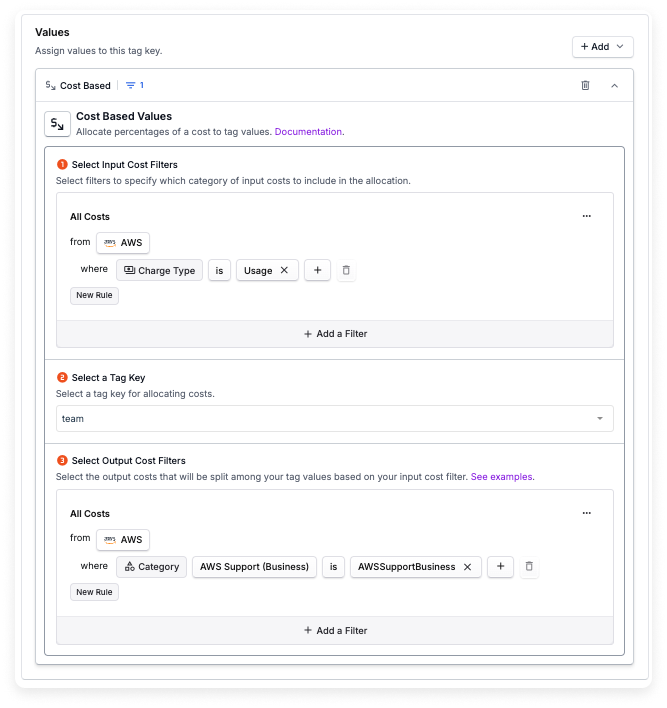
* Select the **Cost-Based** option for the tag value.
For your input cost, select **All AWS Costs**. Set an additional filter for the **Usage** charge type to filter on only usage-related costs. This filter will ignore costs related to items like credits, taxes, fees, etc.
You select your existing **teams** tag key you have in AWS that will be used for allocating costs.
In this example, since your infrastructure team is responsible for 50% of all AWS costs, the mobile team for 20%, and the data team for 30%, you can mimic this allocation across another static cost, or your output cost. Select the filters for the AWS support fee.
Once the tag is created, create a new Cost Report and add the following criteria:
* Create a filter for AWS Support costs.
* Add grouping criteria to group by your new cost-based dynamic allocation tag.
The resulting report shows how much of the support fee each team is allocated.
## Business Metrics-Based Allocation Example
You are working with your infrastructure team and want to ensure that the proportional cost of CPU time on a shared resource is allocated to the distinct cost centers that are consuming the CPU. In this example, you want each team’s portion of CPU usage billed as a corresponding percentage of the overall Namespace CPU cost. So, if Team A uses 30% of the resource’s CPU, then they should be billed a proportional percentage of the total Namespace’s costs.
The diagram shows how labeled CPU usage acts as the allocation driver for the shared Namespace costs.
```mermaid theme={null}
flowchart TD
sharedCpu[Shared resource CPU usage] --> teamAUsage[Team A CPU usage]
sharedCpu --> teamBUsage[Team B CPU usage]
teamAUsage --> namespaceCosts[Namespace costs]
teamBUsage --> namespaceCosts
namespaceCosts --> teamAAllocation[Team A allocation based on CPU share]
namespaceCosts --> teamBAllocation[Team B allocation based on CPU share]
```
To determine the cost of CPU time to allocate to each respective team, you first create a [labeled business metric](/per_unit_costs#labeled-business-metrics) that includes the CPU time labeled by team. Vantage then calculates the respective percentage of CPU time for each team. The labeled business metric has the following format.
```bash theme={null}
date,amount,label
2024-01-09,825,teama
2024-01-09,600,teamb
2024-01-10,500,teama
2024-01-10,200,teamb
2024-01-11,723,teama
2024-01-11,456,teamb
```
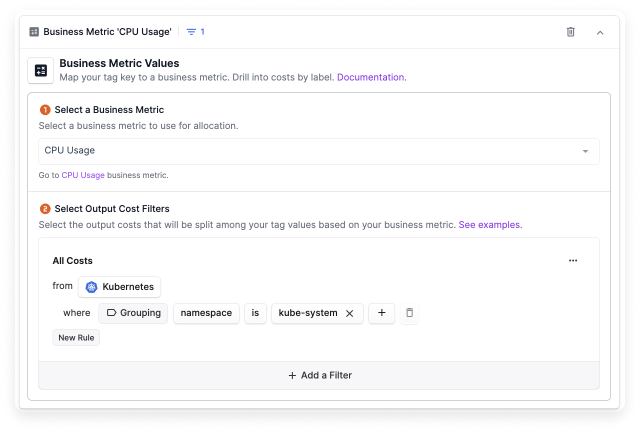
You create a new business metrics-based tag:
* Navigate to **Settings > Tags**.
* Create a new virtual tag.
* Select the **Business Metric** option for the tag value.
Search for and select the labeled business metric you just created to use for allocation.
Select the Vantage costs that will be split based on the percentages calculated in your business metric. In this case, you select a filter to show costs for the specific Namespace you want to be allocated.
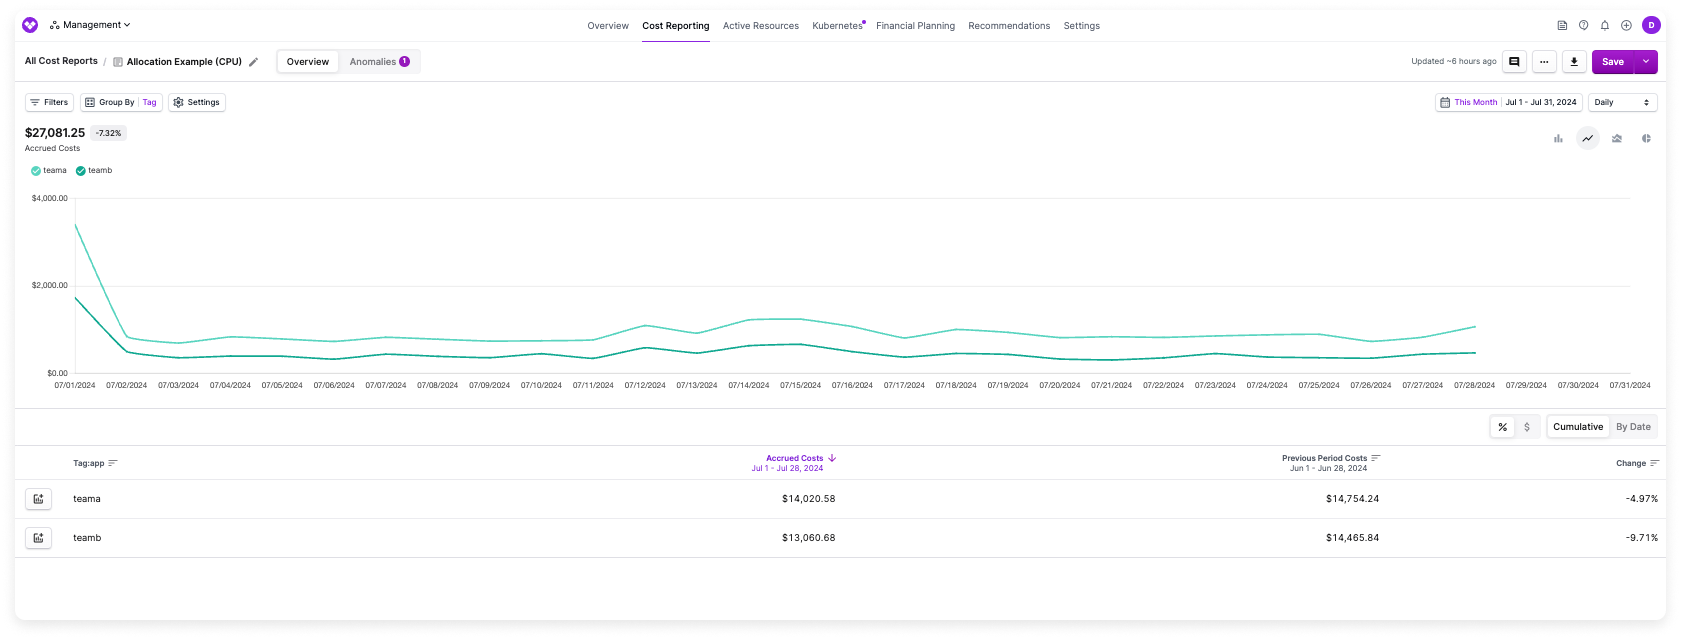
Once the tag is created, create a new Cost Report and add the following criteria:
* Create a filter for the specific Namespace.
* Add grouping criteria to group by your new business metrics-based dynamic allocation tag.
The resulting report shows how much of the Namespace costs each team is allocated.
## Percent-Based Allocation Example
Your organization has negotiated fixed cost splits for Marketplace purchases. For example, at the time of purchase, you pre-agreed that Marketplace costs should be split 60% to the Infrastructure team, 30% to the Mobile team, and 10% to the Data team. You want these allocations to be automatically applied in your chargeback models.
The diagram shows a fixed split where each team receives a predefined percentage of the same Marketplace purchase costs.
```mermaid theme={null}
flowchart TD
marketplace[Marketplace purchase] --> infra["Infra team: 60 percent"]
marketplace --> mobile["Mobile team: 30 percent"]
marketplace --> data["Data team: 10 percent"]
```
You have an existing provider tag in AWS that identifies resources for your teams. This tag will be used to attribute the allocated costs.
* Navigate to **Settings > Tags**.
* Create a new virtual tag (e.g., `Marketplace Allocation`).
* In the **Values** section, click **+Add** and select **Percent-Based**.
* Specify the **Output Costs Filter** to match your Marketplace purchase costs (i.e., costs where **Marketplace purchases Only**).
* Enter the tag value name: `infra`. Titles can contain only letters, numbers, and the following characters: `_ - @ & + , . : / \`.
* Enter the percentage: **60** (between 0 and 100).
* Click **+Add a Tag Value** to add another value.
* Enter the tag value name: `mobile`.
* Enter the percentage: **30**.
* Click **+Add a Tag Value** to add another value.
* Enter the tag value name: `data`.
* Enter the percentage: **10**.
Once the tag is created, create a new Cost Report and add the following criteria:
* Create a filter for Marketplace costs.
* Add grouping criteria to group by your new percent-based allocation tag.
The resulting report shows how much of the costs each team is allocated based on your fixed percentages.
## Allocation-on-Allocation Example
Many FinOps teams need a layered chargeback model. For example, you may first allocate shared AWS costs to high-level teams, then take one team's share and allocate it again to sub-teams for a second level of accountability. Allocation-on-allocation supports this pattern when the allocated tags are part of the same provider-specific allocation chain.
In this example, your organization has three Percent-Based allocated tags for AWS:
* **`Team`** splits all AWS costs across `Engineering`, `Sales`, and `Marketing`.
* **`Sub-Team`** takes the costs already allocated to `Engineering` via the `Team` tag and splits them further across `Frontend`, `Backend`, and `Platform`.
* **`Region`** independently splits all AWS costs across `US`, `EU`, and `APAC`.
Create a Percent-Based allocated tag called `Team` that splits all AWS costs across your primary owners, such as `Engineering`, `Sales`, and `Marketing`.
Create a second Percent-Based allocated tag called `Sub-Team`.
* In the **Output Costs Filter**, select AWS costs where `Team = Engineering`.
* Add the downstream values you need, such as `Frontend`, `Backend`, and `Platform`.
* Set the percentages so the `Engineering` share is fully reallocated across those sub-teams.
Because `Sub-Team` references `Team`, both tags belong to the same AWS allocation chain. That means you can use them together on the same Cost Report.
The diagram shows why `Team` and `Sub-Team` can be used together, while an independent `Region` allocation should be analyzed separately.
```mermaid theme={null}
flowchart LR
awsCosts[AWS costs] --> teamTag["Allocated Tag: Team"]
teamTag --> subTeamTag["Allocated Tag: Sub-Team"]
awsCosts --> regionTag["Allocated Tag: Region"]
teamTag --> sameChain["Same allocation chain:
can be used together"]
subTeamTag --> sameChain
regionTag --> separateChain["Separate allocation chain:
use a separate
Cost Report"]
```
Create a Cost Report and:
* Filter to AWS if needed.
* Group by `Team`.
* Add a second grouping for `Sub-Team`.
This lets you keep the top-level team view while drilling into the `Engineering` portion of the allocation.
If you also create another allocated tag for AWS that does not reference `Team` or `Sub-Team`, such as the separate `Region` allocation in this example, that tag belongs to a different allocation chain. Create a separate Cost Report when you need to analyze that independent AWS allocation.
## Nested Virtual Tags Example
The diagram shows how one Virtual Tag can become an input to another, creating a reporting hierarchy without duplicating every filter rule.
```mermaid theme={null}
flowchart LR
providerCosts[Provider costs] --> applicationsTag["Virtual Tag: Applications"]
applicationsTag --> businessUnitsTag["Virtual Tag: Business Units"]
businessUnitsTag --> reporting[Cost Reports by business unit and application]
```
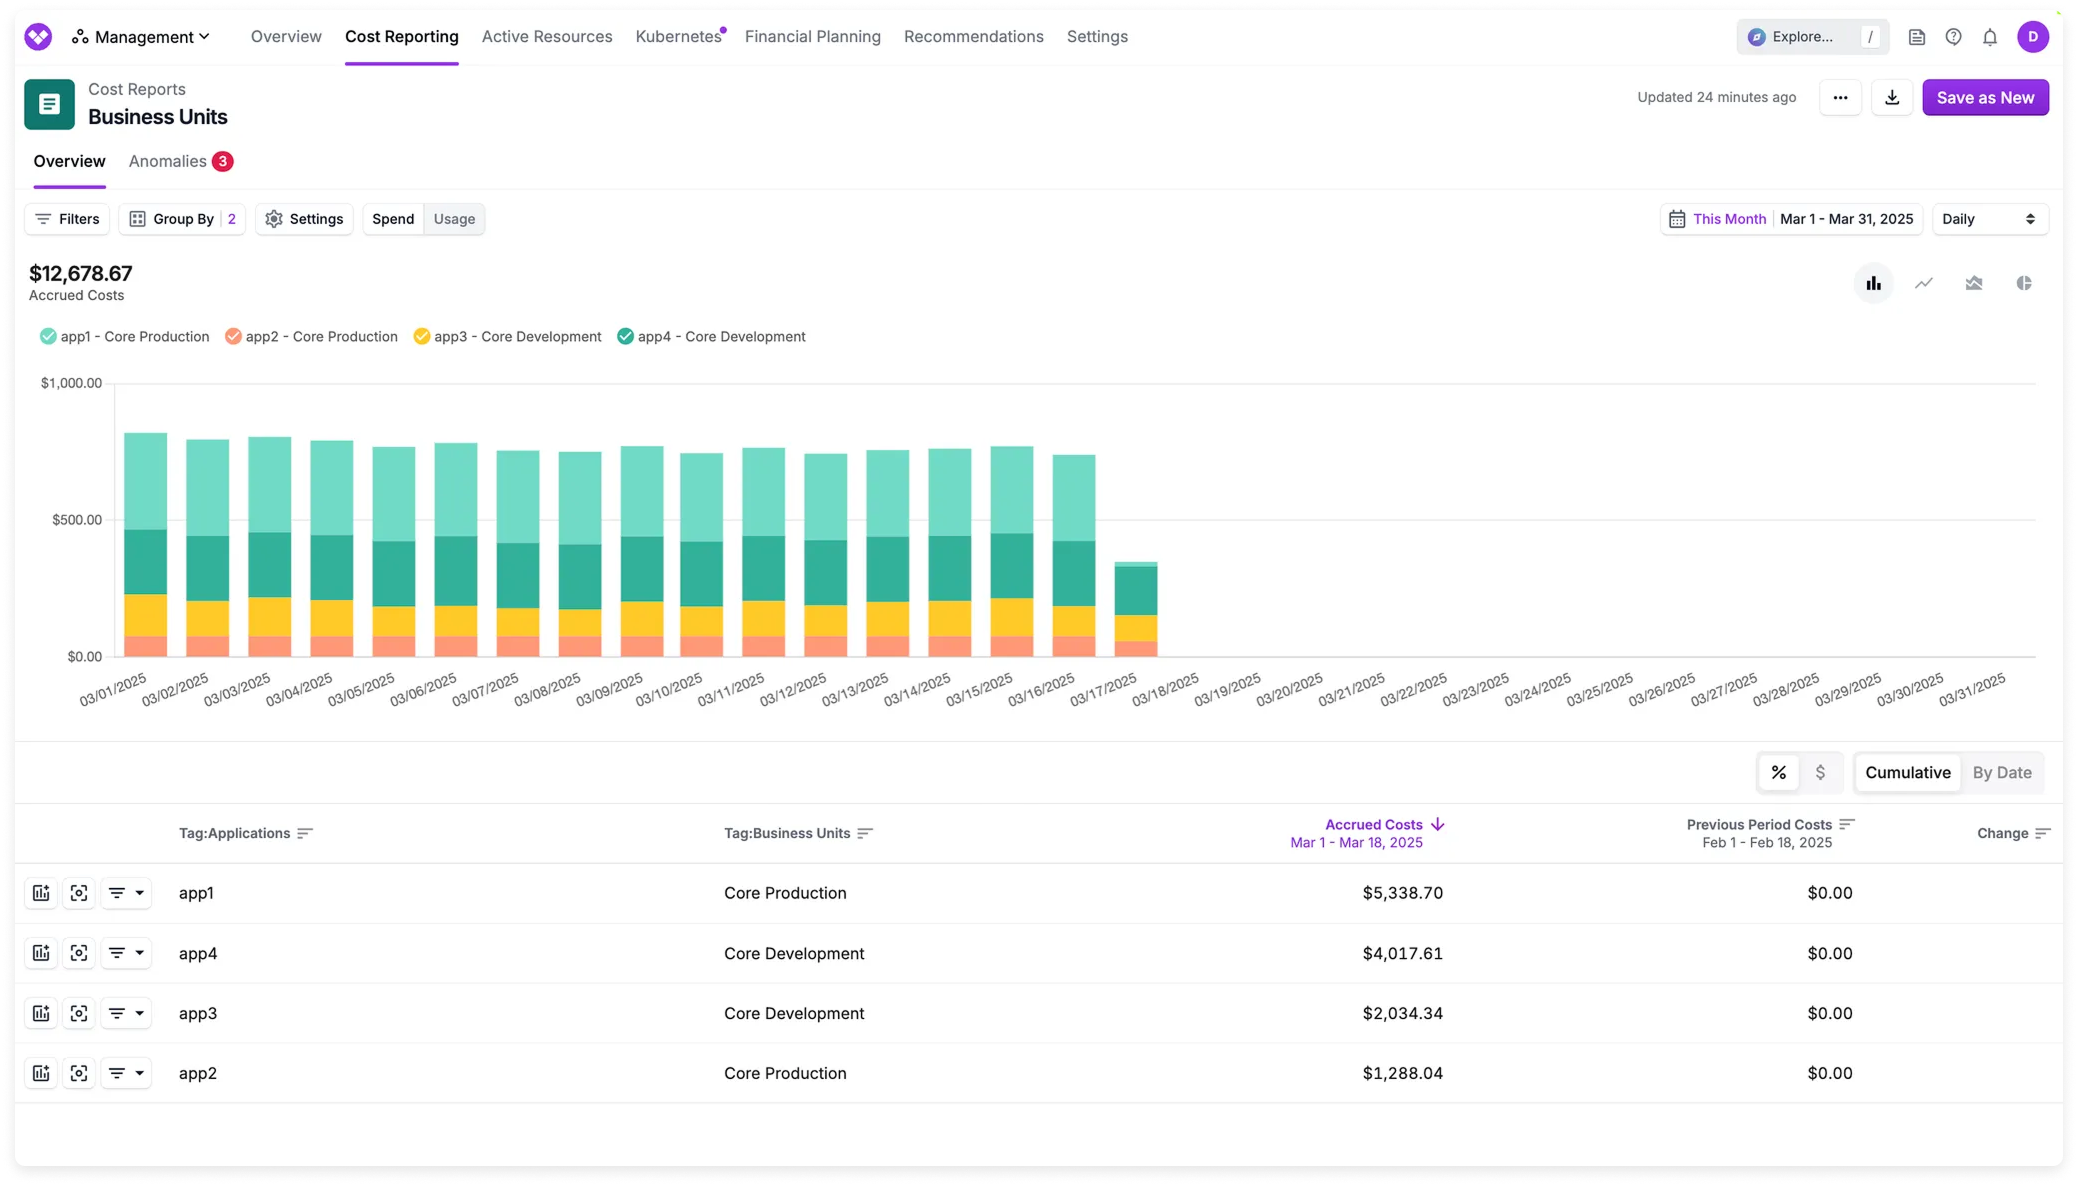
You want to maintain a hierarchy that reflects how your business units are associated with various applications, and track costs of all your applications per business unit over time. In addition, you also want to avoid having to manually update multiple virtual tags whenever an application changes ownership to another business unit, so you aim to set up a dynamic structure that’s automatically updated.
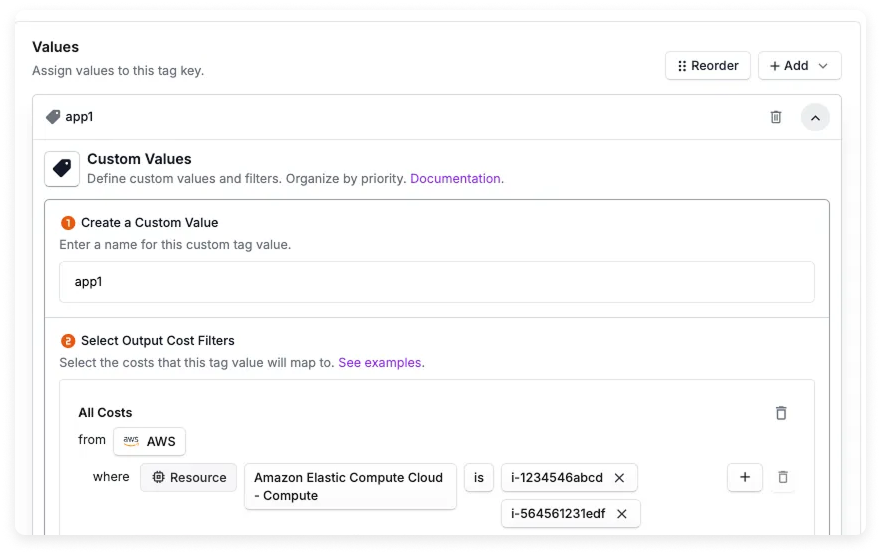
You create a new tag called **Applications**:
* Each value represents a specific application (e.g., app1, app2, app3, app4).
* The filters for each value are AWS costs related to specific resources, like RDS or EC2 instances.
Next, you define a virtual tag for **Business Units**:
* Each value represents a specific business unit (e.g., Core Production, Core Development).
* Each filter uses the preexisting **Applications** virtual tag you just created to associate specific apps with the corresponding business unit. Notice that virtual tags are denoted by a purple Vantage tag icon to differentiate them from provider tags (gray icon).
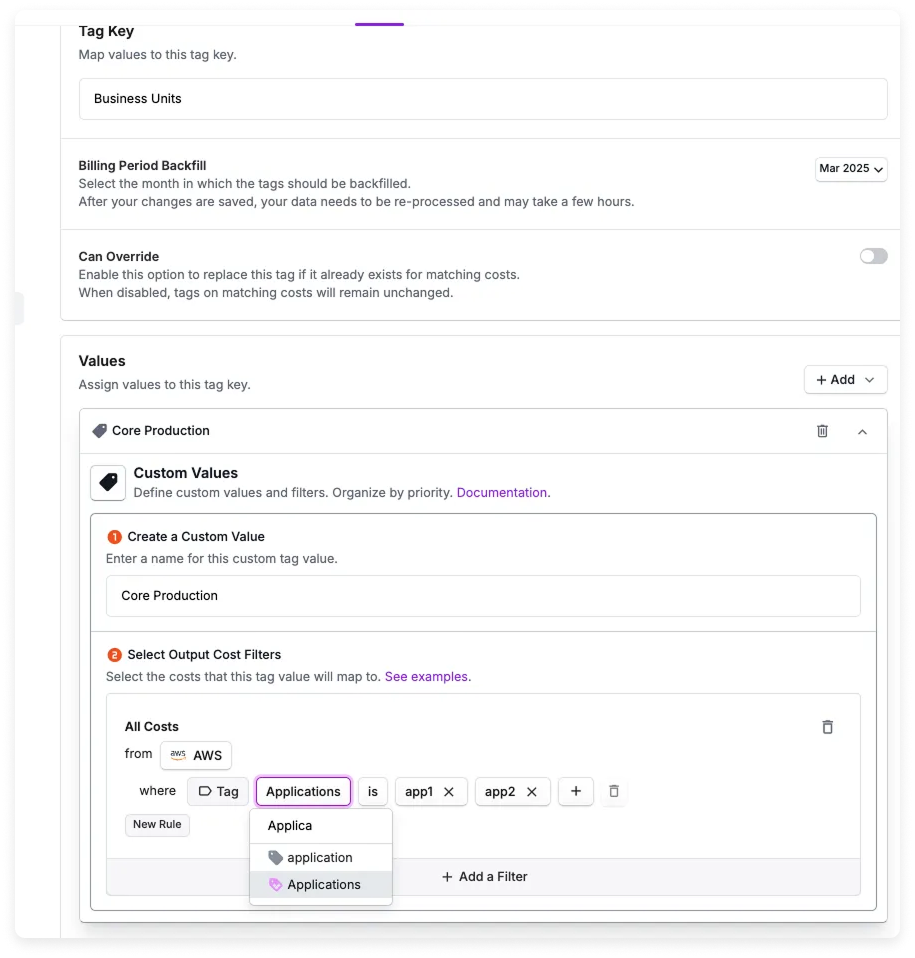
In associated reports, you can track all costs per business unit, knowing that each business unit comprises a set of corresponding apps. If an app ever changes its associated business unit, you need to update only the filter criteria on the **Business Units** virtual tag, and all other costs will be processed accordingly. The following report is grouped both by business unit and application to show the total breakdown.
## Time-Bound Virtual Tag Example
Your organization recently went through a re-org. A shared Kubernetes cluster was owned by the Infrastructure team through June, but in July, responsibility moved to the Platform team. You want your Virtual Tags to reflect this change so that chargeback reports correctly attribute costs to the right team during each period.
The diagram shows the same cluster receiving different Virtual Tag values for different ownership periods.
```mermaid theme={null}
flowchart LR
sharedCluster[Shared Kubernetes cluster] --> juneOwner["Through June:
Infrastructure"]
sharedCluster --> julyOwner["July onward:
Platform"]
```
Navigate to **Settings > Tags** and create a new virtual tag called `Cluster Owner`.
Click **+Add** and select **Assign Custom Value**:
* Enter the tag value name: `infrastructure`.
* Set the **Output Costs Filter** to match the shared Kubernetes cluster (e.g., filter for the specific cluster's resource IDs or namespace).
* Click the **Set a Time Frame** toggle to enable it.
* Leave the **Start Date** empty so the rule applies from the beginning of your data.
* Set the **End Date** to `June 30` to indicate the Infrastructure team's ownership ends at the close of June.
Click **+Add** and select **Assign Custom Value** again:
* Enter the tag value name: `platform`.
* Set the same **Output Costs Filter** to match the shared Kubernetes cluster.
* Click the **Set a Time Frame** toggle to enable it.
* Set the **Start Date** to `July 1`.
* Leave the **End Date** empty so the rule applies indefinitely into the future.
Click **Save**. Vantage will process costs and apply the `infrastructure` value to costs incurred through June 30 and the `platform` value to costs from July 1 onward. In your Cost Reports, you can now group by the `Cluster Owner` tag to see accurate cost attribution across the ownership transition.
## Tagging Untaggable Resources in AWS Example
While you can apply cost and metadata tags in AWS to many resources, there are many other resources that are untaggable in AWS. Therefore, it is hard, if not almost impossible, to achieve 100% allocation in AWS alone. One quick way to first get an inventory of all untagged resources in Vantage—regardless of if they are untaggable—is to create a [Cost Report](/cost_reports) with the following filters:
* Provider is **AWS**
* Where **Not Tagged** with **Any Key**
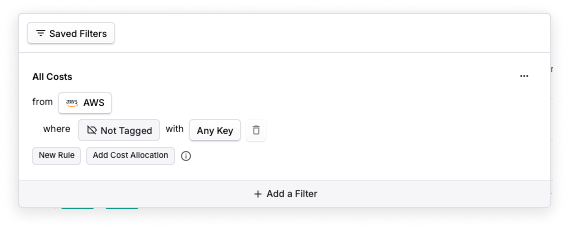
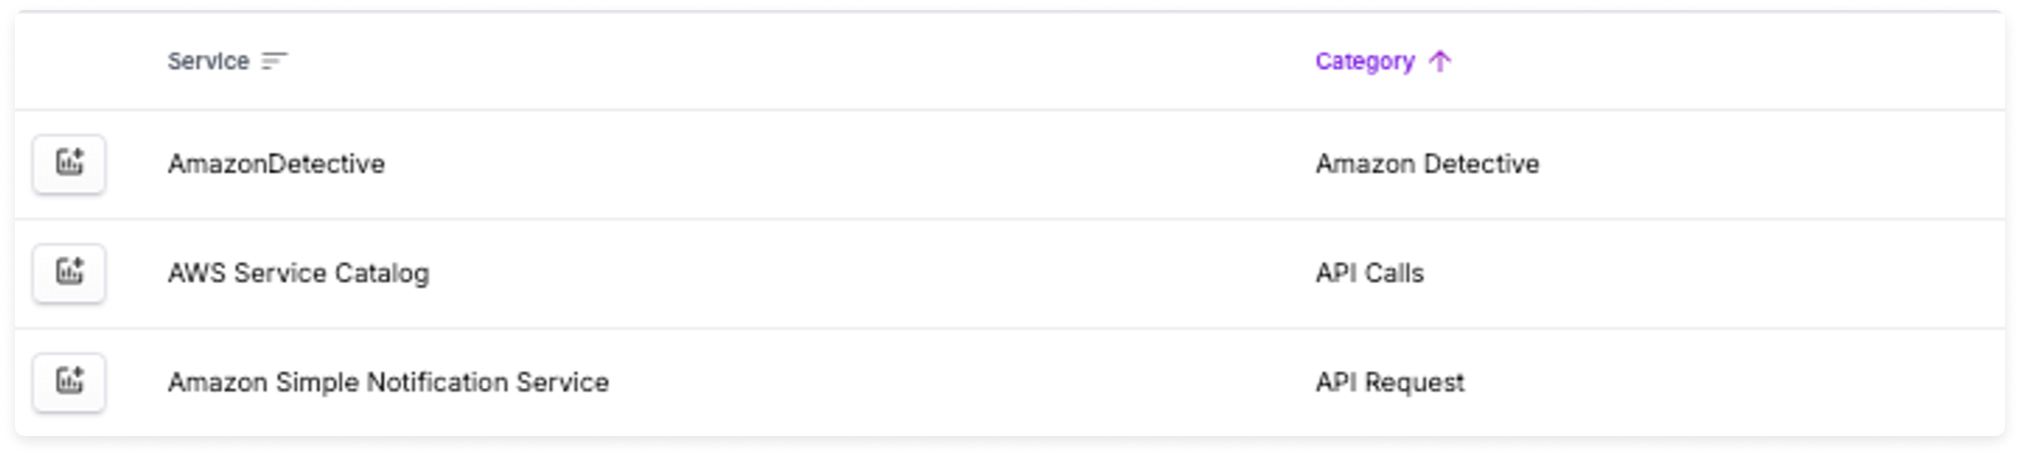
Then, add grouping criteria for **Service** and **Category** to get a view of the types of resources that are currently untagged. If these resources are taggable in AWS, you can add cost allocation tags there and see those tags represented in Vantage when you filter or group by specific tag.
See the [AWS documentation](https://docs.aws.amazon.com/ARG/latest/userguide/supported-resources.html) for more information on what you can tag directly in AWS.
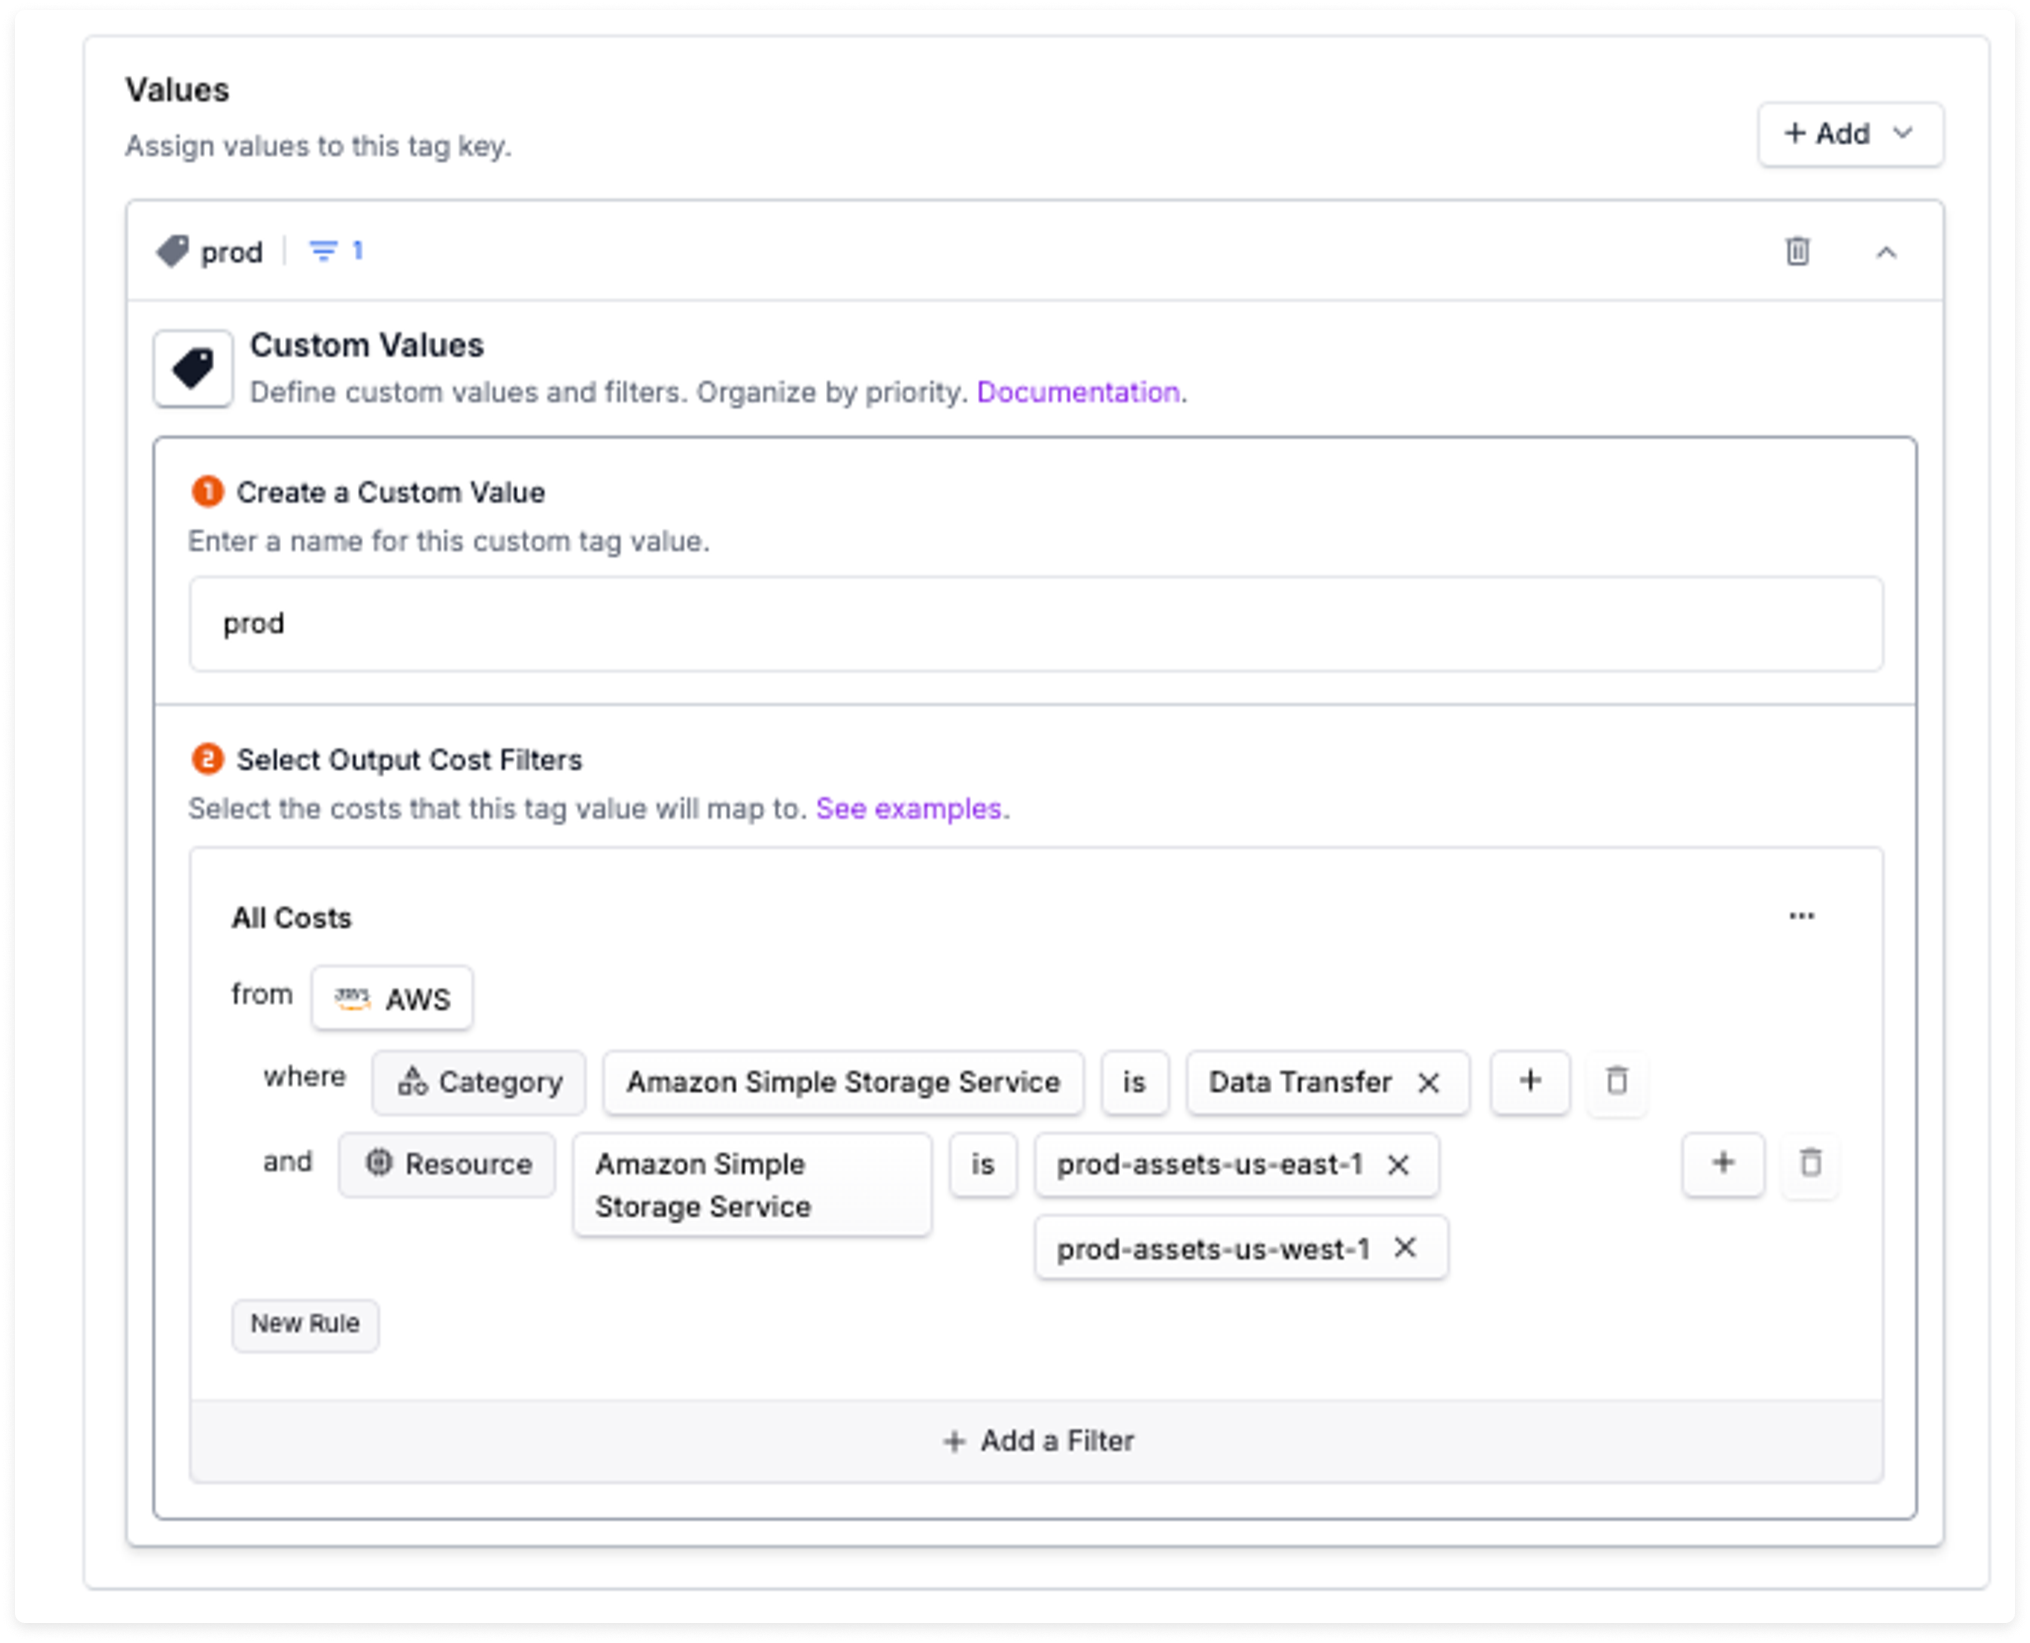
Many services and resource categories, however, cannot be tagged in AWS. You can use virtual tags to create tags in Vantage for these untaggable resources. In the following table, the *Vantage Resource Filters* column represents the filters you can set as the **Output Costs Filter** in the virtual tag configuration.
For example, if you want to tag S3 Data Transfer for specific resources, you could use the following filter criteria.
| AWS Resource | Description | Vantage Resource Filters |
| --------------------- | ------------------------------------------------------------------------------------------------------------------------------------------------------------------------------------------------------------------- | ----------------------------------------------------------------------------------------------------------------------------------------------------------- |
| Elastic IPs | [According to AWS](https://docs.aws.amazon.com/vpc/latest/userguide/vpc-eip-overview.html), "You can tag an Elastic IP address that's allocated for use in a VPC, however, cost allocation tags are not supported." | Provider: AWS Subcategory: Amazon Virtual Private Cloud contains `inuse` |
| CloudWatch Metrics | CloudWatch Metrics involve performance data from AWS services, which are not taggable and are used for monitoring and alerting. | Provider: AWS Category: AmazonCloudWatch is Metric Further filter by resource ID |
| S3 Data Transfer | Data transferred in and out of S3 buckets, which is tracked but not taggable. | Provider: AWS Category: Amazon Simple Storage Service is Data Transfer Further filter by resource ID |
| QuickSight resources | Resources within Amazon QuickSight, such as dashboards and analyses, which do not support tagging. | Provider: AWS Service: Amazon Quicksight Optional detailed filters for Category (e.g., Business Analytics) or individual resource ID |
| CloudSearch resources | Amazon CloudSearch domains and their configurations, which are untaggable. | Provider: AWS Service: Amazon CloudSearch Optional detailed filters for Category (e.g., Data Transfer, Search Instance) or individual resource ID |
## Tag Key Collapsing Examples
The diagram shows multiple provider tag keys flowing into one standardized Virtual Tag key for consistent reporting.
```mermaid theme={null}
flowchart LR
envKey["Tag key: env"] --> environmentTag["Virtual Tag: environment"]
environmentKey["Tag key: environment"] --> environmentTag
capitalEnvironmentKey["Tag key: Environment"] --> environmentTag
environmentTag --> reports[Consistent Cost Reports]
```
### Example 1 - Standardizing Inconsistent Provider Tags
Teams often use variations of the same tag key due to different tagging conventions across your cloud providers. For example:
* `env`, `environment`, `Environment`
* `team`, `Team`, `team_name`
* `app`, `Application`, `application`
With Tag Key Collapsing, you can map all these provider tag variations to a single standardized virtual tag key (e.g., "environment") without needing to update tags in your cloud providers.
Create a new virtual tag with the key name "environment" (or your preferred standardized name).
In the **Collapsed Keys** tab, add all the variations you want to consolidate:
* `env`
* `environment`
* `Environment`
Reorder the collapsed keys so that your preferred collapsed key (for example, if you prefer `environment` over `env`) appears first in the list. This ensures that if a resource has multiple of these tags, the value from the highest-priority collapsed key (the one highest in the list) is used.
Click **Save**. Vantage will automatically merge all values from the collapsed tag keys into your standardized "environment" virtual tag. You can now filter and group by this single tag in your reports.
### Example 2 - Cross-Provider Tag Normalization
If you have the same concept tagged differently across providers (e.g., "team" in AWS and "Team" in Azure), you can collapse both provider tags into a single virtual tag key for consistent reporting across all providers.
Create a new virtual tag with the key name "team" (or your preferred standardized name).
In the **Collapsed Keys** tab, add `team` and `Team` as separate collapsed keys. Expand each row and, under **Add a Filter**, scope to the right cloud provider (for example **Provider** = AWS for `team`, and **Provider** = Azure for `Team`). Set priority if a resource could match both.
Click **Save**. Your reports will now show a consistent "team" tag across both AWS and Azure, regardless of the original tag casing in each provider.
### Example 3 - Collapsing Virtual Tags
You can collapse existing virtual tag keys into other virtual tags, allowing you to create hierarchies or consolidate multiple virtual tags into a single standardized tag. For example, you might collapse several application-related virtual tags into a single "Application" virtual tag for simplified reporting.
Create a new virtual tag with the key name "Application" (or your preferred consolidated name).
In the **Collapsed Keys** tab, add your existing application-related virtual tags:
* "app"
* "App"
* "application"
Reorder the collapsed keys to set your preferred priority order, then click **Save**. All values from the collapsed virtual tags will now appear under the single "Application" virtual tag in your reports.