> ## Documentation Index
> Fetch the complete documentation index at: https://docs.vantage.sh/llms.txt
> Use this file to discover all available pages before exploring further.
# Scenario Models
> Create reusable Scenario Models that represent known future costs, credits, or trends, and combine them into forecasts on your Cost Reports.
Scenario Models are available to Enterprise customers only.
A *Scenario Model* is a reusable set of monthly future-cost periods. Each Scenario Model represents a known future cost, credit, or trend, such as an upcoming committed-use discount, a provider credit, a one-time migration expense, or planned savings from an optimization project.
Once you create a Scenario Model, you can attach it to a forecast on any [Cost Report](/cost_reports). Vantage combines its [Baseline Forecast](/forecasting#baseline-forecast) with the amounts from your selected Scenario Models to produce a forecast that reflects your known future plans. The same Scenario Model can be reused across any number of Cost Reports and forecasts. See [Forecasts from Scenario Models](/forecasting#scenario-model-forecasts) for how the amounts combine with the Baseline Forecast.
## Create a Scenario Model
Managing Scenario Models requires an **Organization Owner**, **Organization Editor**, or **Integration Owner** role. See [RBAC Permissions](/rbac_permissions#financial-planning) for more details.
From the top navigation, click **Financial Planning**, then select **Scenario Models** in the left sidebar. The Scenario Models page lists every Scenario Model in your Vantage account, along with each model's net change, priority, the Cost Reports it is assigned to, when it was last updated, and who created it.
The **Net Change** column summarizes each model's total impact: the sum of its period amounts (a dollar total for Dollar Amount models or a percentage total for Percentage models). A net decrease (savings) is shown in green with a downward arrow, and a net increase in red with an upward arrow; a model with no net change shows a dash (`-`).
A Scenario Model is flagged as **expired** with a clock icon and a **Forecast Expired** tooltip when the latest end date across its periods is in the past. This calculation only considers periods that have an end date; periods with no end date (open-ended) are not counted.
Editing the model so its latest end date is in the current or a future month clears the flag. The flag is informational only—expired models remain selectable and continue to apply on any forecast they're attached to.
 You can create Scenario Models manually or by importing a CSV.
### Create Manually
On the **Scenario Models** page, click **New Scenario Model** in the top right. A new model is displayed with a default name (for example, *New Scenario 1*).
You can create Scenario Models manually or by importing a CSV.
### Create Manually
On the **Scenario Models** page, click **New Scenario Model** in the top right. A new model is displayed with a default name (for example, *New Scenario 1*).
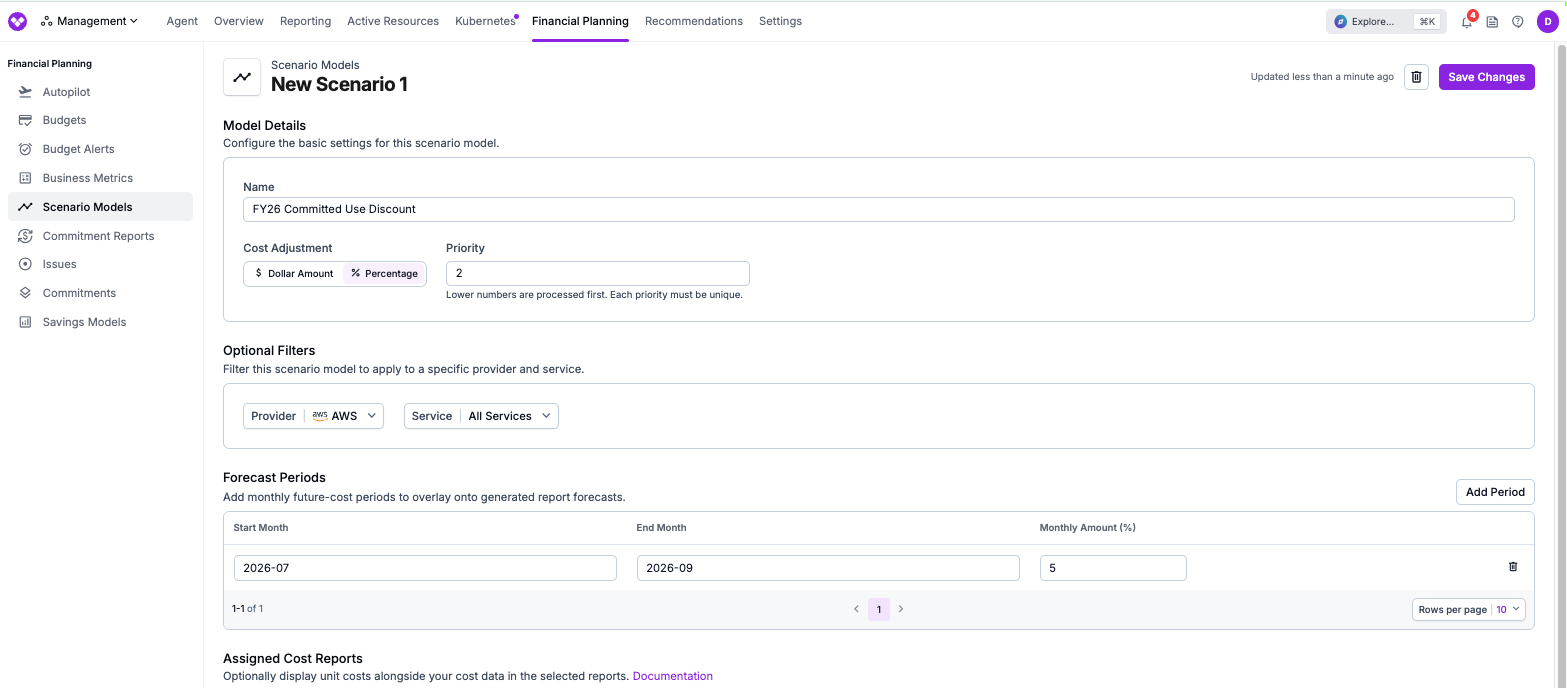 Give the Scenario Model a descriptive name, such as *FY26 Committed Use Discount* or *AWS MAP Credits*.
Under **Model Details**, use the **Cost Adjustment** toggle to choose how the amounts on this model are interpreted:
* **Dollar Amount**: Each period's amount is treated as a dollar value that is added to the forecast for every month in the period's date range.
* **Percentage**: Each period's amount is treated as a percentage that is applied to the forecast for every month in the period's date range.
Use **negative values** in either mode to represent credits, refunds, planned savings, or projected reductions.
When you select **Percentage**, an optional **Priority** field is displayed. Priority sets the order in which percentage models are applied when more than one is attached to the same forecast: lower numbers are processed first. Priority is optional, but any priority you set must be unique within your account. Priority does not apply to Dollar Amount models. See [How Scenario Models combine](/forecasting#how-scenario-models-combine) for details.
Under **Optional Filters**, you can scope the model to a specific **Provider** and, optionally, a **Service** within that provider. Choose a provider to reveal the service selector. Leave these options set to **All Providers**/**All Services** to apply the model to the report's overall forecast.
Provider and service filters apply to both model types. For a **percentage** model, the percentage applies to the matching provider or service's portion of the forecast. For a **dollar** model, the amount is added to the report's total forecast only when that provider or service appears in the report. See [How Scenario Models combine](/forecasting#how-scenario-models-combine) for details.
Under **Forecast Periods**, click **Add Period** for each range of months that the model should cover. For each period, provide:
* **Start Month**: The first month the amount applies to, in `YYYY-MM` format. Month values are interpreted as whole months.
* **End Month**: The last month the amount applies to. Leave blank for an open-ended period. The end month must be on or after the start month.
* **Monthly Amount**: The value applied to each month in the range, interpreted according to the Cost Adjustment type selected above (a dollar amount or a percentage).
Click **Save Changes**. The Scenario Model is now available to attach to forecasts on your Cost Reports.
### Import from a CSV
To create or update many Scenario Models at once, click **Import** on the **Scenario Models** page and upload a CSV. Vantage previews the parsed result before you confirm the import.
Scenario Model CSVs use a row-per-model layout. Each row represents one Scenario Model, and each month column represents one forecasted month:
* **Title column**: The column whose header matches `title` or `name` is used as the model name. If no header matches, the first column is used as the title.
* **Month columns**: Include one column per forecasted month. Every month column header must be in `YYYY-MM` format (for example, `2026-07`). A row with no month values creates a model without any periods.
* **Amount Type column** (optional): Add a column whose header matches `amount type` (or `amount_type`) to control how each row is interpreted. A cell value of `percent` makes that row a percentage model; any other value, or omitting the column entirely, defaults to a dollar model.
* **Cell values**: Each month cell is the amount for that model in that month, a dollar value or a percentage depending on the row's amount type. Values may include `$` and `,`, which are stripped during parsing (for example, `$15,000` is parsed as `15000`). Use negative values for credits or savings (for example, `-8000`).
* **Blank cells**: A blank cell means no amount is applied for that model in that month.
CSV import sets each model's title, amount type, and monthly amounts only. **Priority** and **Provider/Service** filters are not imported from a CSV. You need to set those on the model's detail page after the import.
The following sample creates four Scenario Models: a committed-use discount that runs for the full second half of the year, an AWS MAP credit that applies for three months, a one-time Q4 data migration cost, and a percentage-based efficiency reduction across Q3.
```csv theme={null}
title,amount type,2026-07,2026-08,2026-09,2026-10,2026-11,2026-12
H2 Committed Use Discount,dollar,15000,15000,15000,15000,15000,15000
AWS MAP Credit,dollar,-8000,-8000,-8000,,,
Q4 Data Migration,dollar,,,,25000,25000,
Q3 Efficiency Program,percent,-5,-5,-5,,,
```
The `amount type` column is optional. If you omit it, every row is treated as a dollar model.
In the **Import Scenario Models** dialog, select your CSV file and click **Upload**.
Vantage parses the file and displays a preview of the Scenario Models that will be created or updated. If the file cannot be parsed, Vantage displays one of the following errors:
| Error | Cause | Solution |
| ----------------------------------------------- | ------------------------------------------------------------- | ---------------------------------------------------------------------------------------------------------- |
| `The file is unparseable.` | The file is empty or is not valid CSV. | Confirm the file has content and is a valid CSV, then re-upload. |
| `'' has an invalid date format.` | One or more month column headers are not in `YYYY-MM` format. | Update the header to a valid `YYYY-MM` month and re-upload. |
| `'' appears more than once in the file.` | The CSV contains more than one row with the same name. | Rename or remove the duplicate rows so each Scenario Model name is unique within the file, then re-upload. |
</Step>
<Step title="Confirm the import">
Click **Confirm Import** to upload the Scenario Models. The import runs in the background, and the **Scenario Models** page updates when it completes.
<Warning>
If a Scenario Model in the CSV has the same name as an existing model, the existing model is overwritten with the values from the CSV.
</Warning>
</Step>
</Steps>
## Edit or Delete a Scenario Model
On the main Scenario Models page, click a Scenario Model's row to open its detail page, where you can rename the model, change its Cost Adjustment type, add or remove periods, and change existing amounts or date ranges. Use the delete action to remove the model entirely.
<Warning>
When you **edit** a Scenario Model, Vantage automatically reprocesses every forecast that uses that model on every Cost Report. Affected Cost Reports typically reflect the updated values within approximately 10 minutes. **Deleting** a Scenario Model removes it from every forecast it was attached to.
</Warning>
## View Cost Reports Using a Scenario Model
The Scenario Model detail page includes an **Assigned Cost Reports** section that lists every Cost Report where the Scenario Model is attached to a forecast. For each entry, Vantage displays:
* **Report Name**: The title of the Cost Report. Click the report name to go directly to that report's **Forecasts** tab.
* **Forecast**: The name of the forecast that references this Scenario Model. If the same Scenario Model is attached to multiple forecasts on the same report, all forecast names are listed.
<Frame>
<img alt="The Assigned Cost Reports section of a Scenario Model detail page listing each report name and the forecast that references the model" src="https://assets.vantage.sh/docs/assigned-cost-reports.png" />
</Frame>
Scenario Models are attached to Cost Reports from the Cost Report side, not from this page. To attach this Scenario Model to a new Cost Report, open that report, click the **Forecasts** tab, and create a new forecast that includes this model. See [Forecasts from Scenario Models](/forecasting#scenario-model-forecasts) for the full flow.
## Apply a Scenario Model to a Cost Report
To use a Scenario Model, attach it to a forecast on a Cost Report.
<Card title="Create a Forecast from Scenario Models" icon="chart-mixed" href="/forecasting#scenario-model-forecasts">
See the Forecasting documentation for step-by-step instructions on creating a forecast from one or more Scenario Models, setting it as the default forecast on a Cost Report, and comparing scenarios.
</Card>
Give the Scenario Model a descriptive name, such as *FY26 Committed Use Discount* or *AWS MAP Credits*.
Under **Model Details**, use the **Cost Adjustment** toggle to choose how the amounts on this model are interpreted:
* **Dollar Amount**: Each period's amount is treated as a dollar value that is added to the forecast for every month in the period's date range.
* **Percentage**: Each period's amount is treated as a percentage that is applied to the forecast for every month in the period's date range.
Use **negative values** in either mode to represent credits, refunds, planned savings, or projected reductions.
When you select **Percentage**, an optional **Priority** field is displayed. Priority sets the order in which percentage models are applied when more than one is attached to the same forecast: lower numbers are processed first. Priority is optional, but any priority you set must be unique within your account. Priority does not apply to Dollar Amount models. See [How Scenario Models combine](/forecasting#how-scenario-models-combine) for details.
Under **Optional Filters**, you can scope the model to a specific **Provider** and, optionally, a **Service** within that provider. Choose a provider to reveal the service selector. Leave these options set to **All Providers**/**All Services** to apply the model to the report's overall forecast.
Provider and service filters apply to both model types. For a **percentage** model, the percentage applies to the matching provider or service's portion of the forecast. For a **dollar** model, the amount is added to the report's total forecast only when that provider or service appears in the report. See [How Scenario Models combine](/forecasting#how-scenario-models-combine) for details.
Under **Forecast Periods**, click **Add Period** for each range of months that the model should cover. For each period, provide:
* **Start Month**: The first month the amount applies to, in `YYYY-MM` format. Month values are interpreted as whole months.
* **End Month**: The last month the amount applies to. Leave blank for an open-ended period. The end month must be on or after the start month.
* **Monthly Amount**: The value applied to each month in the range, interpreted according to the Cost Adjustment type selected above (a dollar amount or a percentage).
Click **Save Changes**. The Scenario Model is now available to attach to forecasts on your Cost Reports.
### Import from a CSV
To create or update many Scenario Models at once, click **Import** on the **Scenario Models** page and upload a CSV. Vantage previews the parsed result before you confirm the import.
Scenario Model CSVs use a row-per-model layout. Each row represents one Scenario Model, and each month column represents one forecasted month:
* **Title column**: The column whose header matches `title` or `name` is used as the model name. If no header matches, the first column is used as the title.
* **Month columns**: Include one column per forecasted month. Every month column header must be in `YYYY-MM` format (for example, `2026-07`). A row with no month values creates a model without any periods.
* **Amount Type column** (optional): Add a column whose header matches `amount type` (or `amount_type`) to control how each row is interpreted. A cell value of `percent` makes that row a percentage model; any other value, or omitting the column entirely, defaults to a dollar model.
* **Cell values**: Each month cell is the amount for that model in that month, a dollar value or a percentage depending on the row's amount type. Values may include `$` and `,`, which are stripped during parsing (for example, `$15,000` is parsed as `15000`). Use negative values for credits or savings (for example, `-8000`).
* **Blank cells**: A blank cell means no amount is applied for that model in that month.
CSV import sets each model's title, amount type, and monthly amounts only. **Priority** and **Provider/Service** filters are not imported from a CSV. You need to set those on the model's detail page after the import.
The following sample creates four Scenario Models: a committed-use discount that runs for the full second half of the year, an AWS MAP credit that applies for three months, a one-time Q4 data migration cost, and a percentage-based efficiency reduction across Q3.
```csv theme={null}
title,amount type,2026-07,2026-08,2026-09,2026-10,2026-11,2026-12
H2 Committed Use Discount,dollar,15000,15000,15000,15000,15000,15000
AWS MAP Credit,dollar,-8000,-8000,-8000,,,
Q4 Data Migration,dollar,,,,25000,25000,
Q3 Efficiency Program,percent,-5,-5,-5,,,
```
The `amount type` column is optional. If you omit it, every row is treated as a dollar model.
In the **Import Scenario Models** dialog, select your CSV file and click **Upload**.
Vantage parses the file and displays a preview of the Scenario Models that will be created or updated. If the file cannot be parsed, Vantage displays one of the following errors:
| Error | Cause | Solution |
| ----------------------------------------------- | ------------------------------------------------------------- | ---------------------------------------------------------------------------------------------------------- |
| `The file is unparseable.` | The file is empty or is not valid CSV. | Confirm the file has content and is a valid CSV, then re-upload. |
| `'' has an invalid date format.` | One or more month column headers are not in `YYYY-MM` format. | Update the header to a valid `YYYY-MM` month and re-upload. |
| `'' appears more than once in the file.` | The CSV contains more than one row with the same name. | Rename or remove the duplicate rows so each Scenario Model name is unique within the file, then re-upload. |
</Step>
<Step title="Confirm the import">
Click **Confirm Import** to upload the Scenario Models. The import runs in the background, and the **Scenario Models** page updates when it completes.
<Warning>
If a Scenario Model in the CSV has the same name as an existing model, the existing model is overwritten with the values from the CSV.
</Warning>
</Step>
</Steps>
## Edit or Delete a Scenario Model
On the main Scenario Models page, click a Scenario Model's row to open its detail page, where you can rename the model, change its Cost Adjustment type, add or remove periods, and change existing amounts or date ranges. Use the delete action to remove the model entirely.
<Warning>
When you **edit** a Scenario Model, Vantage automatically reprocesses every forecast that uses that model on every Cost Report. Affected Cost Reports typically reflect the updated values within approximately 10 minutes. **Deleting** a Scenario Model removes it from every forecast it was attached to.
</Warning>
## View Cost Reports Using a Scenario Model
The Scenario Model detail page includes an **Assigned Cost Reports** section that lists every Cost Report where the Scenario Model is attached to a forecast. For each entry, Vantage displays:
* **Report Name**: The title of the Cost Report. Click the report name to go directly to that report's **Forecasts** tab.
* **Forecast**: The name of the forecast that references this Scenario Model. If the same Scenario Model is attached to multiple forecasts on the same report, all forecast names are listed.
<Frame>
<img alt="The Assigned Cost Reports section of a Scenario Model detail page listing each report name and the forecast that references the model" src="https://assets.vantage.sh/docs/assigned-cost-reports.png" />
</Frame>
Scenario Models are attached to Cost Reports from the Cost Report side, not from this page. To attach this Scenario Model to a new Cost Report, open that report, click the **Forecasts** tab, and create a new forecast that includes this model. See [Forecasts from Scenario Models](/forecasting#scenario-model-forecasts) for the full flow.
## Apply a Scenario Model to a Cost Report
To use a Scenario Model, attach it to a forecast on a Cost Report.
<Card title="Create a Forecast from Scenario Models" icon="chart-mixed" href="/forecasting#scenario-model-forecasts">
See the Forecasting documentation for step-by-step instructions on creating a forecast from one or more Scenario Models, setting it as the default forecast on a Cost Report, and comparing scenarios.
</Card>