> ## Documentation Index
> Fetch the complete documentation index at: https://docs.vantage.sh/llms.txt
> Use this file to discover all available pages before exploring further.
# Unit Costs (Business Metrics)
> Calculate and visualize cloud costs per business unit with Vantage Unit Costs.
A *unit* is any metric that your business tracks, such as users, requests, transactions, customers, vendors, and so on. Unit costs can help you analyze the cost of goods sold (COGS). You can add unit costs as a visualization on [Cost Reports](/cost_reports) to visualize your cloud infrastructure costs on a per unit basis. *Business metrics* are the units of data from your business that are aggregated and combined with costs to produce per unit costs on Cost Reports. By importing these business metrics into Vantage, you can track unit costs, like cost per daily active user, COGS per customer, cost per million API requests, etc.
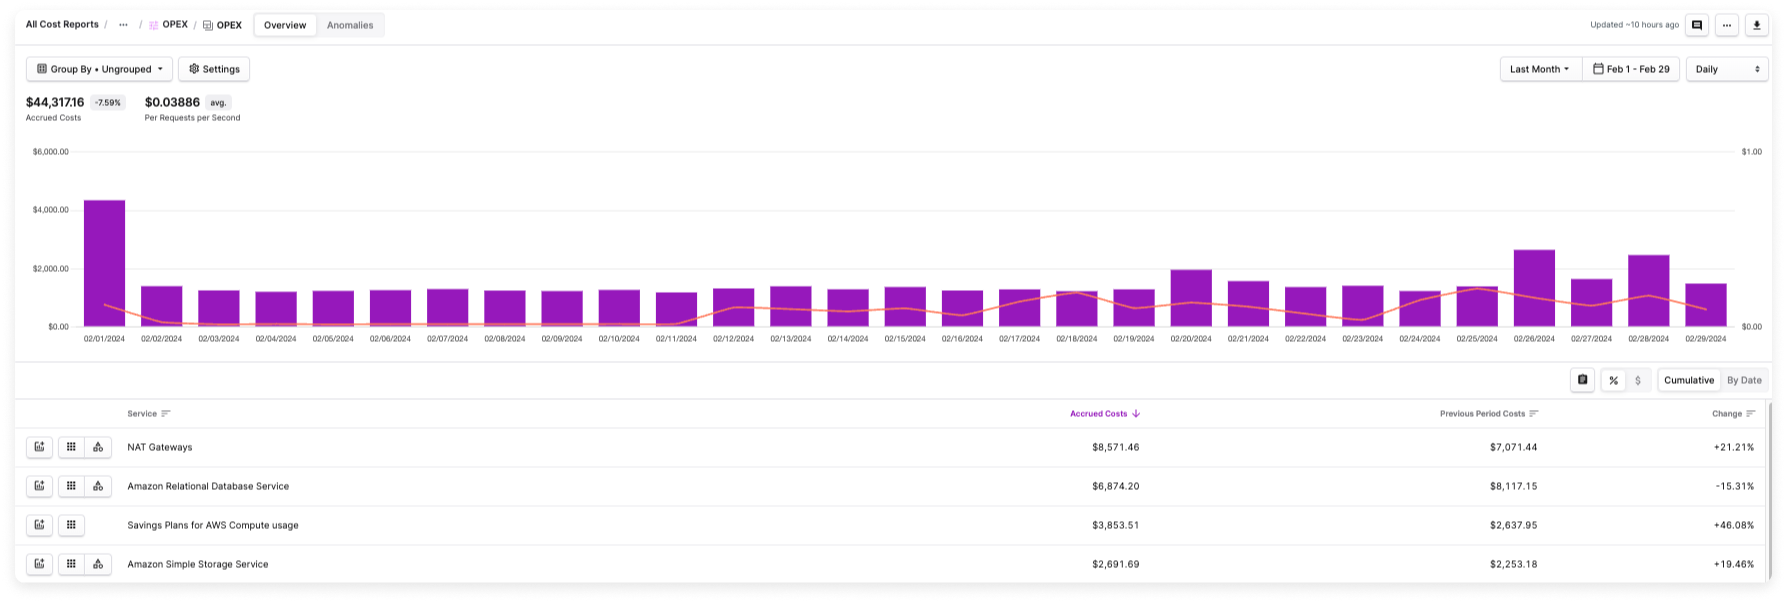
In the visual example below, the business metric **Per Requests per Second** is visualized in the graph as a red line alongside daily costs. You can use this visualization to understand how changes in the request metric contribute to changes in your costs.
 ## Labeled Business Metrics
You can optionally include a label for each uploaded metric. The label identifies the source of the metric—like an associated application or cost center. For example, a metric like *Monthly Active Users* typically applies to more than one application. The ability to allocate these metrics is important for analyzing both overall user activity and individual application performance, enabling more informed decision-making at the application level.
In the above example, you can create labels like *Active Users App A*, *Active Users App B*, etc. When you assign this metric to a Cost Report, you can decide which labels to include on the Cost Report and in the per unit cost calculation. Any labels you decide to include will be aggregated in the per unit cost calculation. So, in this example, if you decide to include only data with the *Active Users App A* label, then unit costs will be calculated only for that set of data. If you also include *Active Users App B*, then the per unit cost calculation will aggregate both sets of labeled data.
## Import Business Metrics
To get started with business metrics and unit costs, you can also view a video demo on [Vantage University](/vantage_university_unit_costs) .
Business metrics can be imported from other systems directly into Vantage and analyzed alongside cost data. You can automatically import metrics from Amazon CloudWatch, Datadog, and Snowflake; import them manually from a CSV file; or upload them via the Vantage API.
The following steps are for creating a Business Metric and importing historical metrics. If you want to automatically import metrics from another application, see [Import via the Vantage API](/per_unit_costs#import-via-the-vantage-api).
From the top navigation, click **Financial Planning**.
On the left navigation, click **Business Metrics**. All existing business metrics are displayed. You can edit or delete business metrics from this screen.
From the top right of the screen, click **New Business Metric**.
Enter a business metric **Title** and click **Create Business Metric**.
The **Business Metrics** screen is displayed with three tabs:
* **Metric Overview**: Displays basic metric information (name, import type, integration details) and allows you to assign the metric to Cost Reports. See the [Assign Business Metrics to Cost Reports](/per_unit_costs#assign-business-metrics-to-cost-reports) section for details.
* **Imported Metrics**: Import historical business metrics from a [CSV file](/per_unit_costs#import-from-a-csv-file), [Amazon CloudWatch](/per_unit_costs#import-from-amazon-cloudwatch), [Datadog](/per_unit_costs#import-from-datadog), [Snowflake](/per_unit_costs#import-from-snowflake), or [upload via the Vantage API](/per_unit_costs#import-via-the-vantage-api). This tab stores your historical metric data and is used for calculating unit costs on Cost Reports. While you can upload any dates (past, present, or future) to this tab, only dates up to the current cost buffer date are used for unit cost calculations. Future dates uploaded here are stored and will automatically appear on Cost Reports once that date becomes current (passes the cost buffer). Only data uploaded to the **Forecasted Metrics** tab will be used for Dynamic Forecasting.
* **Forecasted Metrics**: Upload future projections of your business metrics to create [Dynamic Forecasts](/forecasting#dynamic-forecast). Only data uploaded to this tab will be used for Dynamic Forecasting. This tab accepts CSV uploads only (CloudWatch, Datadog, and Snowflake integrations are not available for forecasted metrics). See the [Forecasted Metrics](/per_unit_costs#forecasted-metrics) section for details.
### Import from a CSV File
You can upload a CSV file that uses the following three-column format. This CSV file can replace existing data or be used to import new data.
The `date` column must be in `YYYY-MM-DD` format. The `amount` column must be a number. The `label` column is optional. See the [section above](/per_unit_costs#labeled-business-metrics) for more information about labels.
A label can be added once per date.
```bash theme={null}
date,amount,label
2024-01-09,295,app1
2024-01-16,909,app1
2024-01-23,934,app1
2024-01-30,772,app1
2024-01-09,344,app2
2024-01-16,789,app2
2024-01-23,922,app2
2024-01-30,768,app2
...
```
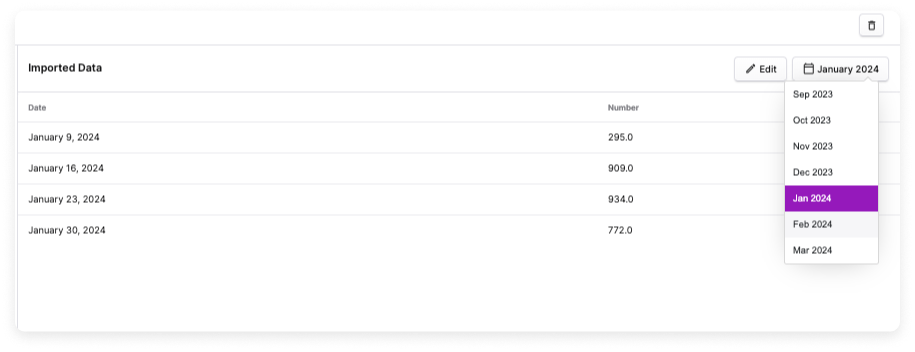
Click the **Imported Metrics** tab, then click **Upload a CSV**. Select the CSV file and upload. After the file is imported, a dropdown menu for each month is displayed. For months with imported metrics, the date and associated metric number are displayed. Months with no metrics are blank.
## Labeled Business Metrics
You can optionally include a label for each uploaded metric. The label identifies the source of the metric—like an associated application or cost center. For example, a metric like *Monthly Active Users* typically applies to more than one application. The ability to allocate these metrics is important for analyzing both overall user activity and individual application performance, enabling more informed decision-making at the application level.
In the above example, you can create labels like *Active Users App A*, *Active Users App B*, etc. When you assign this metric to a Cost Report, you can decide which labels to include on the Cost Report and in the per unit cost calculation. Any labels you decide to include will be aggregated in the per unit cost calculation. So, in this example, if you decide to include only data with the *Active Users App A* label, then unit costs will be calculated only for that set of data. If you also include *Active Users App B*, then the per unit cost calculation will aggregate both sets of labeled data.
## Import Business Metrics
To get started with business metrics and unit costs, you can also view a video demo on [Vantage University](/vantage_university_unit_costs) .
Business metrics can be imported from other systems directly into Vantage and analyzed alongside cost data. You can automatically import metrics from Amazon CloudWatch, Datadog, and Snowflake; import them manually from a CSV file; or upload them via the Vantage API.
The following steps are for creating a Business Metric and importing historical metrics. If you want to automatically import metrics from another application, see [Import via the Vantage API](/per_unit_costs#import-via-the-vantage-api).
From the top navigation, click **Financial Planning**.
On the left navigation, click **Business Metrics**. All existing business metrics are displayed. You can edit or delete business metrics from this screen.
From the top right of the screen, click **New Business Metric**.
Enter a business metric **Title** and click **Create Business Metric**.
The **Business Metrics** screen is displayed with three tabs:
* **Metric Overview**: Displays basic metric information (name, import type, integration details) and allows you to assign the metric to Cost Reports. See the [Assign Business Metrics to Cost Reports](/per_unit_costs#assign-business-metrics-to-cost-reports) section for details.
* **Imported Metrics**: Import historical business metrics from a [CSV file](/per_unit_costs#import-from-a-csv-file), [Amazon CloudWatch](/per_unit_costs#import-from-amazon-cloudwatch), [Datadog](/per_unit_costs#import-from-datadog), [Snowflake](/per_unit_costs#import-from-snowflake), or [upload via the Vantage API](/per_unit_costs#import-via-the-vantage-api). This tab stores your historical metric data and is used for calculating unit costs on Cost Reports. While you can upload any dates (past, present, or future) to this tab, only dates up to the current cost buffer date are used for unit cost calculations. Future dates uploaded here are stored and will automatically appear on Cost Reports once that date becomes current (passes the cost buffer). Only data uploaded to the **Forecasted Metrics** tab will be used for Dynamic Forecasting.
* **Forecasted Metrics**: Upload future projections of your business metrics to create [Dynamic Forecasts](/forecasting#dynamic-forecast). Only data uploaded to this tab will be used for Dynamic Forecasting. This tab accepts CSV uploads only (CloudWatch, Datadog, and Snowflake integrations are not available for forecasted metrics). See the [Forecasted Metrics](/per_unit_costs#forecasted-metrics) section for details.
### Import from a CSV File
You can upload a CSV file that uses the following three-column format. This CSV file can replace existing data or be used to import new data.
The `date` column must be in `YYYY-MM-DD` format. The `amount` column must be a number. The `label` column is optional. See the [section above](/per_unit_costs#labeled-business-metrics) for more information about labels.
A label can be added once per date.
```bash theme={null}
date,amount,label
2024-01-09,295,app1
2024-01-16,909,app1
2024-01-23,934,app1
2024-01-30,772,app1
2024-01-09,344,app2
2024-01-16,789,app2
2024-01-23,922,app2
2024-01-30,768,app2
...
```
Click the **Imported Metrics** tab, then click **Upload a CSV**. Select the CSV file and upload. After the file is imported, a dropdown menu for each month is displayed. For months with imported metrics, the date and associated metric number are displayed. Months with no metrics are blank.
 To add additional metrics or change the value of a metric, update your source CSV file. Then, click **Edit** and upload the edited file. The new or updated metric is displayed in the table. See the [Assign Business Metrics to Cost Reports](/per_unit_costs#assign-business-metrics-to-cost-reports) section for the next steps.
### Import from Amazon CloudWatch
To import business metrics from Amazon CloudWatch, you need a specific metric name and AWS account, as described below. Ensure AWS is one of your [connected providers](/connecting_aws).
If Vantage does not have a Cross-Account IAM Role associated with your AWS account, you need to create one. See the [AWS integration](/connecting_aws) documentation for details.
Click the **Imported Metrics** tab, then click **Import via CloudWatch**.
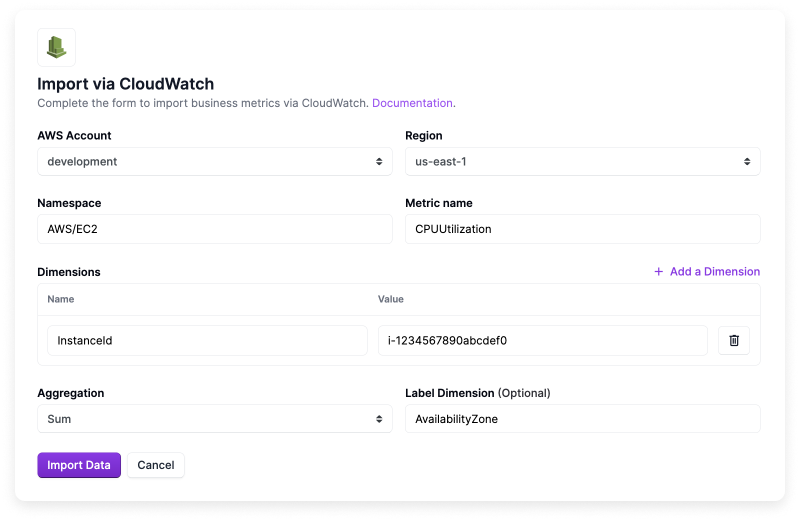
For **AWS Account**, select the connected AWS account you want to import metrics from.
Select an AWS **Region**.
Enter a **Namespace**. A complete list of available namespaces can be found in the AWS documentation for [AWS services that publish CloudWatch Metrics](https://docs.aws.amazon.com/AmazonCloudWatch/latest/monitoring/aws-services-cloudwatch-metrics.html). Namespaces start with `AWS/` followed by the service name (e.g., `AWS/EC2`).
Enter a **Metric name**. Each AWS service has metrics that it [sends to CloudWatch](https://docs.aws.amazon.com/AmazonCloudWatch/latest/monitoring/viewing_metrics_with_cloudwatch.html). Available metrics can be found in CloudWatch or the AWS documentation.
The AWS documentation includes a list of available metrics for services. For example, you can view [EC2 instance metrics](https://docs.aws.amazon.com/AWSEC2/latest/UserGuide/viewing_metrics_with_cloudwatch.html). An example metric to track in this instance is `CPUUtilization`. For [Amazon RDS](https://docs.aws.amazon.com/AmazonRDS/latest/UserGuide/rds-metrics.html), an example metric to track is `WriteIOPS` or `ReadIOPS`.
For **Dimensions**, enter a **Name** and **Value**. [Dimensions](https://docs.aws.amazon.com/AmazonCloudWatch/latest/monitoring/cloudwatch_concepts.html#Dimension) are used to pull specific statistical data for a metric. For example, enter `InstanceId` with a value of `i-1234567890abcdef0`. Each CloudWatch metric has a set of dimensions you can select. Click **+ Add a Dimension** to add more than one dimension.
For each import, you must specify the **Aggregation** function to be used because metrics will be aggregated to the day. Select either **Sum**, **Average**, **Maximum**, or **Minimum**.
Optionally, enter a [dimension **name**](https://docs.aws.amazon.com/AmazonCloudWatch/latest/monitoring/cloudwatch_concepts.html#Dimension) for the **Label Dimension** field.
Click **Import Data**.
To add additional metrics or change the value of a metric, update your source CSV file. Then, click **Edit** and upload the edited file. The new or updated metric is displayed in the table. See the [Assign Business Metrics to Cost Reports](/per_unit_costs#assign-business-metrics-to-cost-reports) section for the next steps.
### Import from Amazon CloudWatch
To import business metrics from Amazon CloudWatch, you need a specific metric name and AWS account, as described below. Ensure AWS is one of your [connected providers](/connecting_aws).
If Vantage does not have a Cross-Account IAM Role associated with your AWS account, you need to create one. See the [AWS integration](/connecting_aws) documentation for details.
Click the **Imported Metrics** tab, then click **Import via CloudWatch**.
For **AWS Account**, select the connected AWS account you want to import metrics from.
Select an AWS **Region**.
Enter a **Namespace**. A complete list of available namespaces can be found in the AWS documentation for [AWS services that publish CloudWatch Metrics](https://docs.aws.amazon.com/AmazonCloudWatch/latest/monitoring/aws-services-cloudwatch-metrics.html). Namespaces start with `AWS/` followed by the service name (e.g., `AWS/EC2`).
Enter a **Metric name**. Each AWS service has metrics that it [sends to CloudWatch](https://docs.aws.amazon.com/AmazonCloudWatch/latest/monitoring/viewing_metrics_with_cloudwatch.html). Available metrics can be found in CloudWatch or the AWS documentation.
The AWS documentation includes a list of available metrics for services. For example, you can view [EC2 instance metrics](https://docs.aws.amazon.com/AWSEC2/latest/UserGuide/viewing_metrics_with_cloudwatch.html). An example metric to track in this instance is `CPUUtilization`. For [Amazon RDS](https://docs.aws.amazon.com/AmazonRDS/latest/UserGuide/rds-metrics.html), an example metric to track is `WriteIOPS` or `ReadIOPS`.
For **Dimensions**, enter a **Name** and **Value**. [Dimensions](https://docs.aws.amazon.com/AmazonCloudWatch/latest/monitoring/cloudwatch_concepts.html#Dimension) are used to pull specific statistical data for a metric. For example, enter `InstanceId` with a value of `i-1234567890abcdef0`. Each CloudWatch metric has a set of dimensions you can select. Click **+ Add a Dimension** to add more than one dimension.
For each import, you must specify the **Aggregation** function to be used because metrics will be aggregated to the day. Select either **Sum**, **Average**, **Maximum**, or **Minimum**.
Optionally, enter a [dimension **name**](https://docs.aws.amazon.com/AmazonCloudWatch/latest/monitoring/cloudwatch_concepts.html#Dimension) for the **Label Dimension** field.
Click **Import Data**.
 The metrics will be automatically synced, daily, along with cost data from other integrations. See the [Assign Business Metrics to Cost Reports](/per_unit_costs#assign-business-metrics-to-cost-reports) section for the next steps.
### Import from Datadog
To import business metrics from Datadog, ensure Datadog is one of your [connected providers](/connecting_datadog). If you do not have Datadog as one of your connected providers, you will be prompted to connect your Datadog account the first time you try to create a metric.
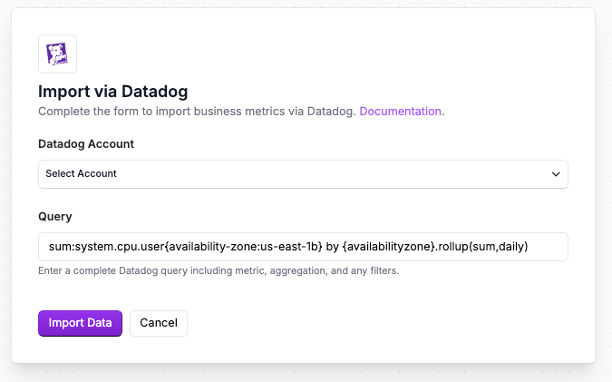
Click the **Imported Metrics** tab, then click **Import via Datadog**.
For **Account**, select the connected Datadog account for which you want to import metrics. If this is your first Datadog metric, you may be prompted to reauthorize your Datadog credentials and the required scopes for Vantage (i.e., `billing_read`, `usage_read`, `metrics_read`, and `timeseries_query` scopes).
For **Raw Query**, enter your Datadog metric, including aggregation, rollup formula, and label filters, into the text field. Your syntax should be similar to the following example:
```bash theme={null}
aws.applicationelb.request_count{availabilityzone:us-east-1c, region:us-east-1}
```
The minimum aggregation for business metrics is daily. If you enter a lower granularity than daily, Vantage will perform aggregation at the daily level. For more information on the Datadog filtering syntax, see the [Datadog documentation](https://docs.datadoghq.com/metrics/advanced-filtering/).
Click **Import Data**.
The metrics will be automatically synced, daily, along with cost data from other integrations. See the [Assign Business Metrics to Cost Reports](/per_unit_costs#assign-business-metrics-to-cost-reports) section for the next steps.
### Import from Datadog
To import business metrics from Datadog, ensure Datadog is one of your [connected providers](/connecting_datadog). If you do not have Datadog as one of your connected providers, you will be prompted to connect your Datadog account the first time you try to create a metric.
Click the **Imported Metrics** tab, then click **Import via Datadog**.
For **Account**, select the connected Datadog account for which you want to import metrics. If this is your first Datadog metric, you may be prompted to reauthorize your Datadog credentials and the required scopes for Vantage (i.e., `billing_read`, `usage_read`, `metrics_read`, and `timeseries_query` scopes).
For **Raw Query**, enter your Datadog metric, including aggregation, rollup formula, and label filters, into the text field. Your syntax should be similar to the following example:
```bash theme={null}
aws.applicationelb.request_count{availabilityzone:us-east-1c, region:us-east-1}
```
The minimum aggregation for business metrics is daily. If you enter a lower granularity than daily, Vantage will perform aggregation at the daily level. For more information on the Datadog filtering syntax, see the [Datadog documentation](https://docs.datadoghq.com/metrics/advanced-filtering/).
Click **Import Data**.
 The metrics will be automatically synced, daily, along with cost data from other integrations. See the [Assign Business Metrics to Cost Reports](/per_unit_costs#assign-business-metrics-to-cost-reports) section for the next steps.
### Import from Snowflake
To import business metrics from Snowflake, ensure Snowflake is one of your [connected providers](/connecting_snowflake). Vantage uses the selected Snowflake integration to run your query, so the configured Snowflake role needs read access to the tables or views referenced in the query. Scheduled query execution consumes Snowflake credits in your account.
Your SQL query must return columns named `date` and `value`. You can optionally return a `label` column for grouped metrics. Use column aliases (`AS`) if your source table uses different column names. When you save the import, Vantage validates the query against Snowflake and requires the query to return at least one row.
Snowflake imports use `value` in the SQL result set. CSV and API imports use `amount` for the metric value.
Common Snowflake-backed metrics include daily requests, users, sessions, seats, transactions, orders, or product-specific usage events, such as AI invocations. For example, if several teams share one CloudFront distribution, you could import daily request counts by team from Snowflake. Vantage would import rows like `2026-01-01, 1500000, team-a`, where `date` is the usage date, `value` is the number of requests, and `label` is the team. You could then attach that metric to a Cost Report filtered to the shared CloudFront distribution and use a **Unit Scale** like **Per Million** to view cost per million requests. For allocation use cases, the same `label` values can represent teams, applications, customers, or cost centers.
Click the **Imported Metrics** tab, then click **Import via Snowflake**.
For **Snowflake Integration**, select the connected Snowflake integration you want to query. If you have not connected Snowflake, click **Connect Snowflake** and complete the [Snowflake integration](/connecting_snowflake) setup first. Confirm the `vantage` user you created during connection has read access to any of the databases and schemas that you want to use for business metrics.
For **SQL Query**, enter a query that returns `date`, `value`, and optionally `label` columns. In the shared CloudFront distribution example discussed earlier, the following query imports daily request counts by team:
```sql theme={null}
SELECT
CAST(request_date AS DATE) AS date,
COUNT(*) AS value,
team AS label
FROM analytics.cloudfront_requests
WHERE distribution_id = 'E123EXAMPLE'
GROUP BY date, label
```
If this data is already modeled in Snowflake, such as in a dbt model or analytics view, query that model directly and alias the output columns to `date`, `value`, and optionally `label`. If the query references objects outside the database or schema configured for the Snowflake integration, use fully qualified names like `database.schema.table` and confirm the Vantage Snowflake role has `SELECT` access.
Click **Import Data**.
The metrics will be automatically synced, daily, along with cost data from other integrations. See the [Assign Business Metrics to Cost Reports](/per_unit_costs#assign-business-metrics-to-cost-reports) section for the next steps.
### Import via the Vantage API
You can import business metrics to Vantage, from other applications, with the Vantage API. Use the `/business_metrics` endpoint to view, create, update, and delete business metrics. You can also delete specific business metric values by date range and label with [`DELETE /business_metrics/{token}/values`](https://docs.vantage.sh/api/businessmetrics/delete-business-metric-values). Ensure you have a valid Read/Write [Vantage API token](/api/authentication). See the [API documentation](https://docs.vantage.sh/api/businessmetrics/get-all-business-metrics) for details on how to use these endpoints.
## Assign Business Metrics to Cost Reports
The metrics will be automatically synced, daily, along with cost data from other integrations. See the [Assign Business Metrics to Cost Reports](/per_unit_costs#assign-business-metrics-to-cost-reports) section for the next steps.
### Import from Snowflake
To import business metrics from Snowflake, ensure Snowflake is one of your [connected providers](/connecting_snowflake). Vantage uses the selected Snowflake integration to run your query, so the configured Snowflake role needs read access to the tables or views referenced in the query. Scheduled query execution consumes Snowflake credits in your account.
Your SQL query must return columns named `date` and `value`. You can optionally return a `label` column for grouped metrics. Use column aliases (`AS`) if your source table uses different column names. When you save the import, Vantage validates the query against Snowflake and requires the query to return at least one row.
Snowflake imports use `value` in the SQL result set. CSV and API imports use `amount` for the metric value.
Common Snowflake-backed metrics include daily requests, users, sessions, seats, transactions, orders, or product-specific usage events, such as AI invocations. For example, if several teams share one CloudFront distribution, you could import daily request counts by team from Snowflake. Vantage would import rows like `2026-01-01, 1500000, team-a`, where `date` is the usage date, `value` is the number of requests, and `label` is the team. You could then attach that metric to a Cost Report filtered to the shared CloudFront distribution and use a **Unit Scale** like **Per Million** to view cost per million requests. For allocation use cases, the same `label` values can represent teams, applications, customers, or cost centers.
Click the **Imported Metrics** tab, then click **Import via Snowflake**.
For **Snowflake Integration**, select the connected Snowflake integration you want to query. If you have not connected Snowflake, click **Connect Snowflake** and complete the [Snowflake integration](/connecting_snowflake) setup first. Confirm the `vantage` user you created during connection has read access to any of the databases and schemas that you want to use for business metrics.
For **SQL Query**, enter a query that returns `date`, `value`, and optionally `label` columns. In the shared CloudFront distribution example discussed earlier, the following query imports daily request counts by team:
```sql theme={null}
SELECT
CAST(request_date AS DATE) AS date,
COUNT(*) AS value,
team AS label
FROM analytics.cloudfront_requests
WHERE distribution_id = 'E123EXAMPLE'
GROUP BY date, label
```
If this data is already modeled in Snowflake, such as in a dbt model or analytics view, query that model directly and alias the output columns to `date`, `value`, and optionally `label`. If the query references objects outside the database or schema configured for the Snowflake integration, use fully qualified names like `database.schema.table` and confirm the Vantage Snowflake role has `SELECT` access.
Click **Import Data**.
The metrics will be automatically synced, daily, along with cost data from other integrations. See the [Assign Business Metrics to Cost Reports](/per_unit_costs#assign-business-metrics-to-cost-reports) section for the next steps.
### Import via the Vantage API
You can import business metrics to Vantage, from other applications, with the Vantage API. Use the `/business_metrics` endpoint to view, create, update, and delete business metrics. You can also delete specific business metric values by date range and label with [`DELETE /business_metrics/{token}/values`](https://docs.vantage.sh/api/businessmetrics/delete-business-metric-values). Ensure you have a valid Read/Write [Vantage API token](/api/authentication). See the [API documentation](https://docs.vantage.sh/api/businessmetrics/get-all-business-metrics) for details on how to use these endpoints.
## Assign Business Metrics to Cost Reports
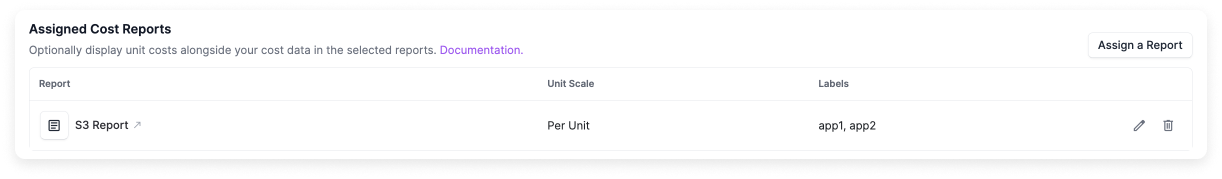 Once your import is complete, you can assign metrics to one or more Cost Reports. You can also assign as many different business metrics to a Cost Report as you want.
Under **Assigned Cost Reports**, click **Assign a Report**.
The **Assign a Report** popup window is displayed. In the **Report** dropdown menu, search for and select a Cost Report.
For **Unit Scale**, select either **Per Unit**, **Per Hundred**, **Per Thousand**, **Per Million**, or **Per Billion**. The scale is used to divide the business metric before calculating the cost per unit. Use this scale to create a per-unit cost, such as *Cost per Thousand Requests*. If you select **Per Unit**, no division occurs, and the actual metric number will be used within the Cost Report.
For **Label Filter**, select any labels that were imported with your data.
* Any selected labels will be aggregated and applied to the Cost Report to calculate the per unit costs. For example, if you select the labels `app1` and `app2`, the per unit cost calculation will be an aggregate of the corresponding values for those labels. If you select only `app1`, then the per unit cost calculation will only apply to values that correspond with the `app1` label.
* You can also select the **unlabeled** option, which includes any values that don't have a corresponding label.
Click **Save**. The metric is displayed on the corresponding Cost Report based on the selected scale and optionally selected labels.
## Forecasted Metrics
Dynamic forecasting is available to Enterprise customers only.
You can upload projected future values of your business metrics to create [Dynamic Forecasts](/forecasting#dynamic-forecast) that align your cost projections with business growth expectations. When you upload forecasted business metrics, Vantage analyzes historical correlations between your costs and metrics, then incorporates your projections into forecasting models. You can create one forecast per business metric. To model different scenarios, update your existing forecast with new projected values, and all associated Cost Reports will reflect the updated projections.
Follow the steps in the [Import Business Metrics](/per_unit_costs#import-business-metrics) section above if you haven't created a business metric yet.
Once you've uploaded historical costs, select the **Forecasted Metrics** tab.
Only data uploaded to the **Forecasted Metrics** tab will be used for Dynamic Forecasting. Upload either a CSV file with your projected metrics, or use [the Vantage API](/per_unit_costs#import-via-the-vantage-api). Use the same CSV format as historical data, optionally including [labels](/per_unit_costs#labeled-business-metrics), for example:
```csv theme={null}
date,amount,label
2026-11-01,5000,app1
2026-11-02,5200,app1
2026-11-03,5400,app1
2026-11-01,3000,app2
2026-11-02,3100,app2
2026-11-03,3200,app2
```
You cannot upload forecasted metrics through the native Datadog, CloudWatch, or Snowflake business metrics integrations. Forecasted metrics must be uploaded manually via CSV or API.
Assign the business metric to a Cost Report if you haven't already. See the [Assign Business Metrics to Cost Reports](/per_unit_costs#assign-business-metrics-to-cost-reports) section for details.
Review the [Forecasting](/forecasting#dynamic-forecast) documentation to learn how to view your Dynamic Forecast on Cost Reports and compare forecast types.
## View Per Unit Costs on Cost Reports
Once your import is complete, you can assign metrics to one or more Cost Reports. You can also assign as many different business metrics to a Cost Report as you want.
Under **Assigned Cost Reports**, click **Assign a Report**.
The **Assign a Report** popup window is displayed. In the **Report** dropdown menu, search for and select a Cost Report.
For **Unit Scale**, select either **Per Unit**, **Per Hundred**, **Per Thousand**, **Per Million**, or **Per Billion**. The scale is used to divide the business metric before calculating the cost per unit. Use this scale to create a per-unit cost, such as *Cost per Thousand Requests*. If you select **Per Unit**, no division occurs, and the actual metric number will be used within the Cost Report.
For **Label Filter**, select any labels that were imported with your data.
* Any selected labels will be aggregated and applied to the Cost Report to calculate the per unit costs. For example, if you select the labels `app1` and `app2`, the per unit cost calculation will be an aggregate of the corresponding values for those labels. If you select only `app1`, then the per unit cost calculation will only apply to values that correspond with the `app1` label.
* You can also select the **unlabeled** option, which includes any values that don't have a corresponding label.
Click **Save**. The metric is displayed on the corresponding Cost Report based on the selected scale and optionally selected labels.
## Forecasted Metrics
Dynamic forecasting is available to Enterprise customers only.
You can upload projected future values of your business metrics to create [Dynamic Forecasts](/forecasting#dynamic-forecast) that align your cost projections with business growth expectations. When you upload forecasted business metrics, Vantage analyzes historical correlations between your costs and metrics, then incorporates your projections into forecasting models. You can create one forecast per business metric. To model different scenarios, update your existing forecast with new projected values, and all associated Cost Reports will reflect the updated projections.
Follow the steps in the [Import Business Metrics](/per_unit_costs#import-business-metrics) section above if you haven't created a business metric yet.
Once you've uploaded historical costs, select the **Forecasted Metrics** tab.
Only data uploaded to the **Forecasted Metrics** tab will be used for Dynamic Forecasting. Upload either a CSV file with your projected metrics, or use [the Vantage API](/per_unit_costs#import-via-the-vantage-api). Use the same CSV format as historical data, optionally including [labels](/per_unit_costs#labeled-business-metrics), for example:
```csv theme={null}
date,amount,label
2026-11-01,5000,app1
2026-11-02,5200,app1
2026-11-03,5400,app1
2026-11-01,3000,app2
2026-11-02,3100,app2
2026-11-03,3200,app2
```
You cannot upload forecasted metrics through the native Datadog, CloudWatch, or Snowflake business metrics integrations. Forecasted metrics must be uploaded manually via CSV or API.
Assign the business metric to a Cost Report if you haven't already. See the [Assign Business Metrics to Cost Reports](/per_unit_costs#assign-business-metrics-to-cost-reports) section for details.
Review the [Forecasting](/forecasting#dynamic-forecast) documentation to learn how to view your Dynamic Forecast on Cost Reports and compare forecast types.
## View Per Unit Costs on Cost Reports
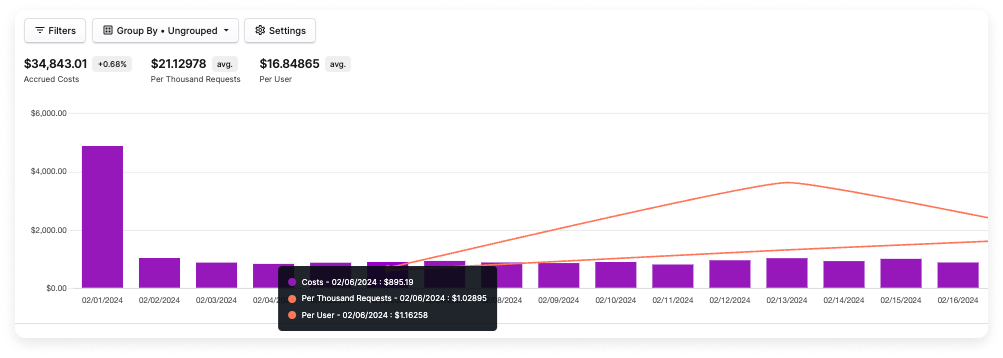 To inspect your unit costs, navigate to the assigned Cost Report. The average unit cost for the date range selected is displayed at the top of the screen. This average is calculated by first binning business metrics according to the selected date bucket (day, week, or month), then dividing the total costs by the total binned business metrics for date bins where both costs and metrics are available. This ensures accurate results that respect the date bucket size used by the report.
To see the cost per unit line, ensure your view is set to daily, weekly, or monthly.
Hover over a data point to see the cost per unit for that day, week, or month. If you add multiple business metrics to the same Cost Report, each business metric is displayed as a separate line, as shown in the example above.
To inspect your unit costs, navigate to the assigned Cost Report. The average unit cost for the date range selected is displayed at the top of the screen. This average is calculated by first binning business metrics according to the selected date bucket (day, week, or month), then dividing the total costs by the total binned business metrics for date bins where both costs and metrics are available. This ensures accurate results that respect the date bucket size used by the report.
To see the cost per unit line, ensure your view is set to daily, weekly, or monthly.
Hover over a data point to see the cost per unit for that day, week, or month. If you add multiple business metrics to the same Cost Report, each business metric is displayed as a separate line, as shown in the example above.