> ## Documentation Index
> Fetch the complete documentation index at: https://docs.vantage.sh/llms.txt
> Use this file to discover all available pages before exploring further.
# LLM Enrichment Import History
> Understand every column, status, and percentage on the Import History screen for LLM Enrichment sources.
Every LLM Enrichment source has an **Import History** screen that answers one question: for a given provider and billing period, how much of your logged usage actually became enriched cost, and where the rest went. This page explains every column, status, and number on that screen.
Import History works the same way for all enrichment integrations.
| Integration | How To Open Import History |
| ----------------------------------------------------------------------------------------- | -------------------------------------------------------------------------------------------------- |
| [Custom LLM Enrichment](/custom_llm_enrichment#view-import-history) | Select the bucket name in the sources table. The details page opens on the **Import History** tab. |
| [Cloudflare AI Gateway Enrichment](/cloudflare_ai_gateway_enrichment#view-import-history) | Click the ellipses (**...**) next to the row and select **View import history**. |
| [AWS Bedrock LLM Enrichment](/aws_bedrock_enrichment#view-import-history) | Click the ellipses (**...**) next to the row and select **View import history**. |
The screen has two levels: the **Enrichment Runs** table gives you one line per run, and the **Token Metrics** screen behind it breaks a single run down into the two stages that can lose usage.
## Enrichment Runs Table
The table lists one row for each combination of provider cost integration (a connected provider account, such as a single OpenAI project or AWS account) and billing period that ran enrichment. Rows are ordered by the most recent run first. When a billing period is enriched more than once, only the latest run for that period appears. Re-enrichment replaces the row rather than adding a new one.

Enrichment runs in two stages, and the columns below report on both. In the **log scan**, Vantage reads your log files and builds an index of the token usage it finds. Your logs carry one record per request, written one record per line, so a log line and a log record are the same thing. In the **join**, Vantage matches that indexed usage to your **cost rows**, meaning the individual line items on your provider's bill.
| Column | What It Shows |
| -------------------- | ------------------------------------------------------------------------------------------------------------------------------------------------------------------------------------------------------------------------------------------------------------------------------------------- |
| **Integration** | The provider cost integration this run enriched, with the provider account (for example, an OpenAI project or an AWS account ID) on the second line. Two rows can name the same provider and differ only by account, so the second line is what tells them apart. |
| **Status** | The outcome of the run. See [Status Values](#status-values). |
| **Tokens Kept** | The share of indexed tokens that Vantage attached to a cost row. This is the only cell that contains a link: where a run has a percentage, select it to open [Token Metrics](#token-metrics-log-scan-and-join) for that run. |
| **Log Lines Kept** | The share of log lines Vantage could read and index. Lines expected to skip, like duplicates or failed requests, are left out of this number rather than counted against it. |
| **Bill Match** | The share of the provider cost rows Vantage tried to enrich that received logged usage. In other words, of the bill lines that could take logged usage, how many actually got some. Rows that carry no token usage, such as non-LLM charges, are not counted in either half of this number. |
| **Billing Period** | The period the run covered. A full calendar month shows as `Jul 2026`; a partial period shows as a date range. |
| **Last Enriched At** | When this enrichment run finished. The table sorts on this value, so the newest run is always at the top. |
Lifecycle changes appear as their own rows, mixed in with the runs by date: **Added** when enrichment is first enabled for an integration, and **Paused** or **Resumed** when you stop, disable, resume, or re-enable it. These rows record an event rather than a run, so they have no billing period and show `-` in all three percentage columns.
If the table shows an **Import history unavailable** alert, the page could not load the history data. Select **Retry**. If the table is empty and shows **No data available.**, no enrichment run has recorded a result for this source yet; this is expected until the provider's next data refresh completes.
## Status Values
| Status | What It Means |
| ---------------------- | --------------------------------------------------------------------------------------------------------------------------------------------------------------------------------------------------- |
| **Stable** | The run completed and wrote enriched cost rows. This is the healthy state. |
| **Warning** | The run found your logs but produced no enriched output. |
| **Error** | The run failed. The failure reason is shown on the source's row in the sources table on the integration page, not here. |
| **Paused** | Enrichment is stopped for this source or integration. Also appears as a lifecycle marker row at the moment you stopped it. |
| **No logs** | Vantage found no usable logs for this billing period, so there was nothing to enrich. Common for periods before you started delivering logs, or for a period where delivery to your bucket stopped. |
| **Added**, **Resumed** | Lifecycle marker rows, not runs. See [Enrichment Runs Table](#enrichment-runs-table). |
| **Unknown** | An unrecognized state. Contact [Vantage Support](mailto:support@vantage.sh) if a row stays in this state. |
Each row records a run that has already finished, so you will not see in-progress states like **Pending** or **Importing** here. Those describe the source as a whole and appear on the sources table on the integration page.
One message can appear in red beneath the status badge: `Multiple cost integrations share this bucket and the logs have no resource_account_id.` More than one cost integration for the same provider reads from this bucket, and your log records do not say which account each request belongs to. Vantage withholds that usage rather than attributing it to the wrong account. Add `resource_account_id` to your records, or point each integration at its own bucket.
## Reading the Three Percentages
The three percentages (Log Lines Kept, Tokens Kept, and Bill Match) look similar but measure different things at different stages, so a low number in one column tells you something very different from a low number in another. In short, Log Lines Kept is about your logs, while Tokens Kept and Bill Match are about matching those logs to the bill. Enrichment brings two streams together, the usage in your logs and the cost rows on your provider bill, and each arrow below is labeled with the percentage that measures that step:
```mermaid theme={null}
flowchart LR
Logs["Your log files in S3"] --> Scan["Log Scan"]
Scan -->|"Log Lines Kept"| Join["Join"]
Bill["Your provider bill"] -->|"Bill Match"| Join
Join -->|"Tokens Kept"| Enriched["Enriched cost rows"]
```
| Metric | Stage | Counts | A Low Value Means |
| ------------------ | -------- | ------------------ | ------------------------------------------------------------------------------------------------------------------------------------------------------------------------ |
| **Log Lines Kept** | Log Scan | Log lines | Vantage could not read or index many of your log lines. The problem is in the logs themselves: malformed log records, missing required fields, or unreadable timestamps. |
| **Tokens Kept** | Join | Tokens | Your logs were read fine, but the usage in them did not line up with your provider bill. The problem is in matching, not in the logs. |
| **Bill Match** | Join | Provider cost rows | Many of your provider's cost rows received no logged usage at all, so they passed through unsplit. Often this means your logs cover only part of your traffic. |
A few things to keep in mind when you read these numbers:
* **Bill Match is calculated for the entire cost import:** If more than one enrichment source feeds the same cost integration, they share the same Bill Match value.
* **Tokens Kept and Log Lines Kept are not comparable to each other:** One counts tokens after the join, the other counts log lines before it. It is normal to see a high Log Lines Kept alongside a lower Tokens Kept.
* **A low percentage does not change your totals:** usage Vantage cannot attribute stays on a **leftover** row, the unallocated remainder of the original cost row, so the enriched rows always add back up to what the provider billed.
For the current month, the two most recent days are left out of these percentages (and out of the Token Metrics behind them). Vantage usually receives your logs before your provider's bill for the same day arrives, so it waits about two days for the bill to catch up. Scoring those days early would make the numbers look artificially low. Finished months are not affected.
## Token Metrics: Log Scan and Join
Select the **Tokens Kept** percentage on any run to open the **Token Metrics** screen.
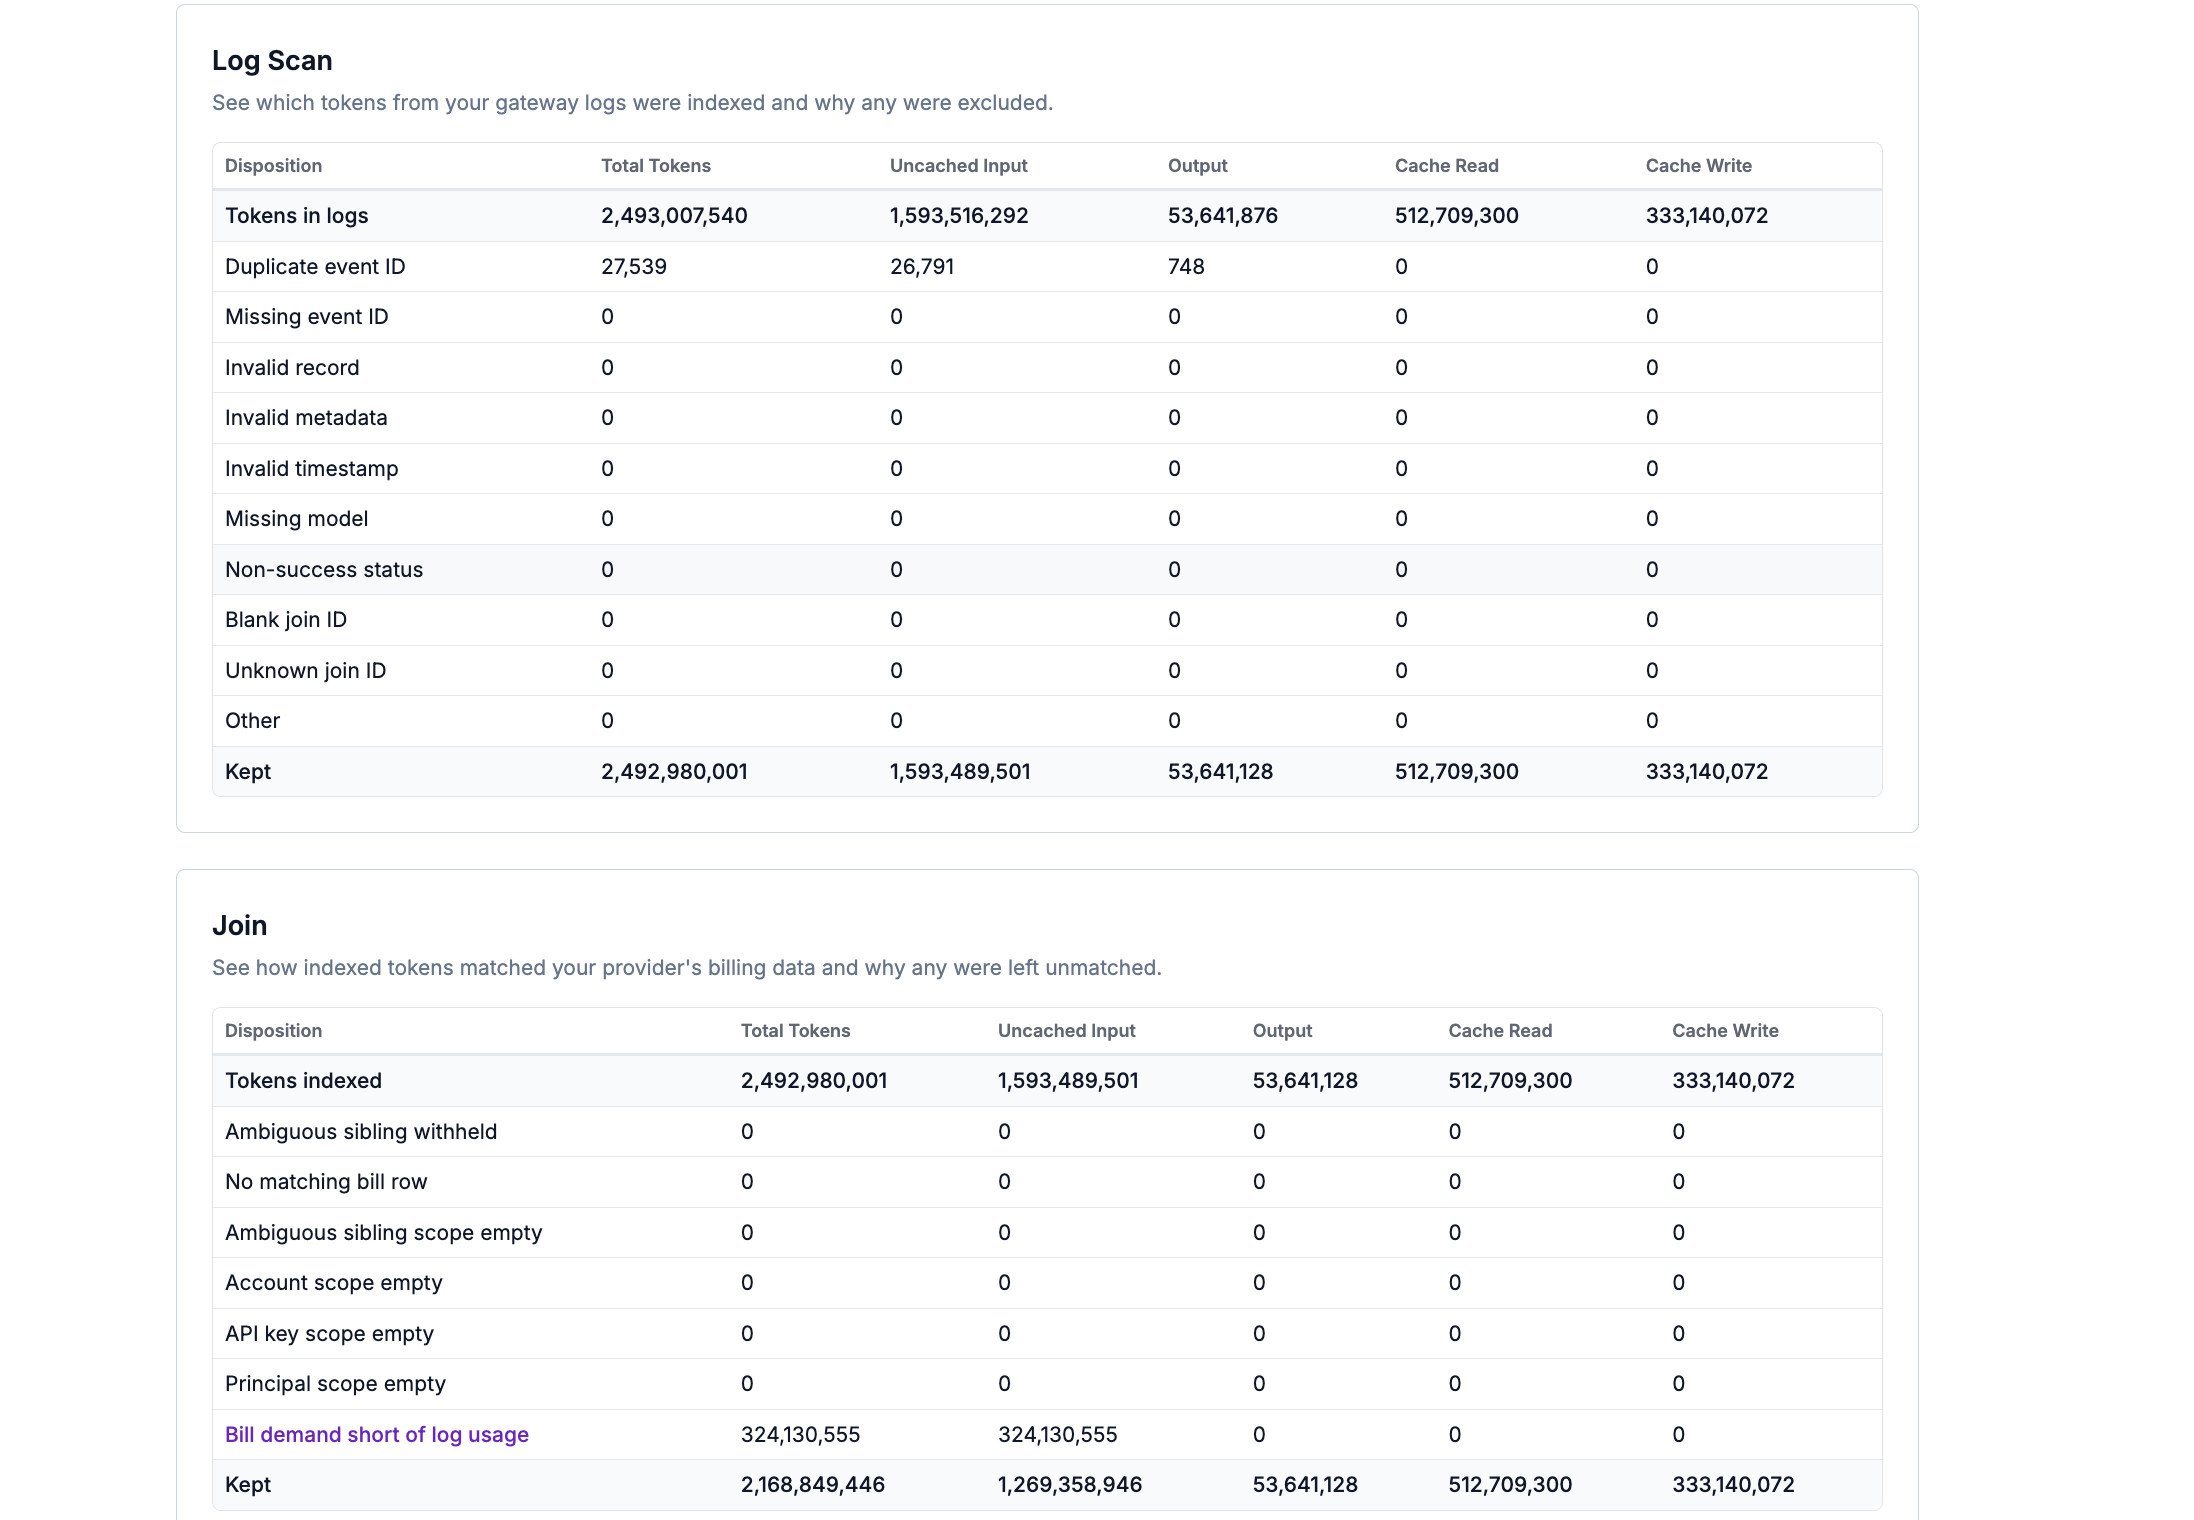
The screen has two sections, **Log Scan** and **Join**, one for each stage. Both use the same columns:
| Column | What It Shows |
| ------------------ | ------------------------------------------------------------------------------------------------------------------------ |
| **Disposition** | What happened to this group of tokens. |
| **Total Tokens** | All four token kinds added together (i.e., the Uncached Input, Output, Cache Read, and Cache Write columns that follow). |
| **Uncached Input** | Input tokens that were not served from a cache. |
| **Output** | Tokens the model generated. |
| **Cache Read** | Input tokens read from a cache. |
| **Cache Write** | Input tokens written to a cache. |
Each section starts with a shaded total row and ends with a shaded **Kept** row. Everything between them is usage that did not make it through that stage. Read a section top to bottom: the total at the top, the reasons in the middle, and what survived at the bottom.
In both tables, any reason row that carried tokens is a link. Select it to open [sample records](#view-sample-records): up to 25 real examples of the affected requests, which are the fastest way to see what actually went wrong. The shaded total rows are never links, and neither are **Duplicate event ID** or **Missing event ID**, which Vantage does not keep samples for.
### Log Scan Dispositions
Log Scan covers reading your log files and building the usage index. It starts from **Tokens in logs**, the total Vantage read for the period, and ends at **Kept**, the tokens handed to the join.
This table counts tokens, while the **Log Lines Kept** percentage on the previous screen counts log lines, so the two do not line up one for one. A single large request can move the token numbers here far more than it moves the log line percentage.
| Disposition | What It Means | What To Do |
| ---------------------- | --------------------------------------------------------------------------------------------------------------------------------------- | ---------------------------------------------------------------------------------------------------------------------------------------- |
| **Tokens in logs** | Every token Vantage read from your log objects for this period. This is the starting total. | Nothing; this is the baseline. |
| **Duplicate event ID** | Another record for the same day already used this identifier. Vantage keeps the record with the highest token count and drops the rest. | Usually expected if your pipeline can deliver a record more than once. Investigate only if the number is large relative to your traffic. |
| **Missing event ID** | The record had no identifier Vantage could use to deduplicate it. | Emit a stable, unique identifier on every record. |
| **Invalid record** | The line was not a JSON object Vantage could parse. | Confirm you write one JSON object per line, with no wrapping array and no truncated lines. |
| **Invalid metadata** | The record's metadata field was missing or was not an object. | Confirm your metadata is emitted as a key/value object. |
| **Invalid timestamp** | The timestamp was blank or could not be read as a date, so Vantage could not tell which billing day the record belongs to. | Emit UTC timestamps in a standard format. |
| **Missing model** | The record named no model, or the model value was blank after normalization. | Emit the model exactly as the provider reports it. |
| **Non-success status** | The request was not successful, so it is not billable usage. | Expected. These are requests that failed, were rate limited, or returned an error. |
| **Blank join ID** | The value Vantage joins on (the normalized model) was empty. | Same fix as **Missing model**: emit a model on every record. |
| **Unknown join ID** | A model was present, but Vantage could not match it to a model it recognizes in your cost data. | Check for typos, internal aliases, or a model your provider bill does not itemize. |
| **Other** | A drop reason that does not fall into the categories above. | Uncommon. Open its sample records to see what these are. |
| **Kept** | Tokens that made it into the usage index and were passed to the join. | Nothing; this is the surviving total. |
### Join Dispositions
Join covers matching indexed usage to your provider's cost rows. It starts from **Tokens indexed**, which equals the **Kept** value from Log Scan, and ends at **Kept**, the tokens that were allocated onto cost rows.
Each disposition names the point where matching stopped. Vantage first matches on the model and token kind, then narrows the result by account, API key, and calling identity.
| Disposition | What It Means | What To Do |
| ---------------------------------- | ------------------------------------------------------------------------------------------------------------------------------------------------------------------------------------ | ---------------------------------------------------------------------------------------------------------------------------------------------------------------------------------- |
| **Tokens indexed** | Every token the Log Scan kept and handed to the join. This is the starting total. | Nothing; this is the baseline. |
| **Ambiguous sibling withheld** | Several cost integrations for the same provider share this bucket and the logs do not say which account each request belongs to, so Vantage withheld the usage rather than guessing. | Add `resource_account_id` to your records, or give each integration its own bucket. |
| **No matching bill row** | There was no cost row for that day, provider, model, and token kind. | The most common cause is a model your provider bill does not itemize separately, or a day whose bill has not landed yet. Recent days often resolve themselves on the next refresh. |
| **Ambiguous sibling scope empty** | The usage matched a cost row, but narrowing by account produced nothing because of the same shared-bucket ambiguity described above. | Same fix as **Ambiguous sibling withheld**. |
| **Account scope empty** | The usage matched on model and token kind, but no cost row came from the same provider account. | Confirm the `resource_account_id` in your logs matches the account on the connected cost integration. |
| **API key scope empty** | The usage matched, but no cost row carried the same API key identity. | Confirm the API key identifier in your logs matches the one your provider reports on the bill. |
| **Principal scope empty** | The usage matched, but no cost row carried the same calling identity (IAM principal). | Applies to [AWS Bedrock](/aws_bedrock_enrichment#iam-principal-normalization). Confirm the principal in your logs matches the caller identity on your cost rows. |
| **Bill demand short of log usage** | Matching succeeded on every field, but the bill reported less usage than your logs did, so the surplus tokens had no cost left to attach to. | Normal and not an error. Your logs simply counted more tokens than the provider billed for. No cost is lost. |
| **Kept** | Tokens that were allocated onto cost rows and became enriched, tagged spend. | Nothing; this is the surviving total. |
Unmatched tokens do not change your totals. Whatever portion of a cost row your logs did not account for stays on a **leftover** row, which keeps the provider's existing tags but none of your enrichment tags, so the enriched rows always add back up to the original cost row to the cent.
## View Sample Records
Where a disposition name appears as a link, select it to open a dialog with up to 25 sample records for that disposition.
* **Samples from Log Scan section:** Show the log record as Vantage read it, with your custom tags removed, plus the reason it was not indexed. Compare a sample to a record you expect to work and look for the missing or malformed field.
* **Samples from Join section:** Always name the `model` and `usage_kind` that went unmatched, and most dispositions add the fields described below. **Bill demand short of log usage** is the exception and shows only `model` and `usage_kind`, because nothing failed to match: the bill simply ran out of usage to attach.
A Log Scan sample is your own record with tags removed and the skip reason appended, so you can read it against a record you know works. In the example below, the application sent an internal alias instead of the model name the provider reports, so Vantage could not resolve it:
```json Log Scan sample: unknown join ID theme={null}
{
"event_id": "ail_9f2c41ba7d",
"timestamp": "2026-07-14T09:22:41.108Z",
"provider": "openai",
"model": "gpt5-mini-internal",
"resource_account_id": "proj_abc123",
"service_tier": "default",
"usage": {
"input_tokens": 1840,
"output_tokens": 96
},
"reason": "unknown_join_id"
}
```
A join sample describes one unmatched join key rather than one request. The record below never found a cost row at all: `stage` is `not_joined`, `matched_on` is empty because matching stopped at the very first comparison, and `failed_on` names the model as the reason.
```json Join sample: no matching bill row theme={null}
{
"model": "default:gpt-5.2-2025-12-11",
"usage_kind": "input",
"stage": "not_joined",
"matched_on": [],
"failed_on": "model",
"failed_on_log_values": [],
"log_records_indexed": 214,
"log_records_matched": 0,
"log_records_unmatched": 214
}
```
This next record got much further. It matched a cost row on the model and token kind, then lost it when Vantage narrowed by provider account. Because it reached the `not_matched` stage, `failed_on_log_values` shows the account identifier your logs actually carried, which you can compare against the account on the connected cost integration.
```json Join sample: account scope empty theme={null}
{
"model": "default:gpt-5.2-2025-12-11",
"usage_kind": "output",
"stage": "not_matched",
"matched_on": ["model", "usage_kind"],
"failed_on": "resource_account_id",
"failed_on_log_values": ["proj_abc123"],
"log_records_indexed": 512,
"log_records_matched": 0,
"log_records_unmatched": 512
}
```
**Bill demand short of log usage** is the one join disposition whose samples look different. Nothing failed to match, so there is no `stage`, `matched_on`, or `failed_on`. The record names only the model and token kind that had surplus tokens. This is expected, not an error.
```json Join sample: bill demand short of log usage theme={null}
{
"model": "default:gpt-5.2-2025-12-11",
"usage_kind": "input"
}
```
A join sample can include the following fields:
| Field | What It Tells You |
| --------------------------------------------------------------------- | ------------------------------------------------------------------------------------------------------------------------------------------------------------------------------------------------------------------------------ |
| `model` | The join key for the unmatched usage. See [Join Key Format](#join-key-format); this is not a plain model name. |
| `usage_kind` | The token kind involved: `input`, `output`, `cache_read`, or `cache_write`. |
| `stage` | How far the usage got. `not_joined` means it never found a cost row to attach to. `not_matched` means it found one, but narrowing by account, API key, or calling identity ruled it out. |
| `matched_on` | The fields that did agree, listed in the order Vantage compares them: model, usage kind, account, API key, then principal. An empty list means matching stopped at the very first comparison. |
| `failed_on` | The field where matching stopped. This is the most important value in the record. |
| `failed_on_log_values` | The values your logs carried for the field named in `failed_on`. Populated only at the `not_matched` stage, so it is empty for `not_joined` records. |
| `log_records_indexed`, `log_records_matched`, `log_records_unmatched` | How many logged requests for this key were indexed, how many attached to a cost row, and how many were left over. Useful for judging whether a disposition covers a handful of requests or a meaningful share of your traffic. |
For a **No matching bill row** record, `failed_on` narrows the cause considerably:
* `failed_on: "model"` means your bill has no cost row for that model at all. Check whether the provider bills it under a different name, or whether the tier encoded in the join key matches a tier the provider actually bills.
* `failed_on: "usage_kind"` means the model *is* on your bill, but not for that token kind. This is common for cache tokens on models where the provider does not itemize caching separately.
Not every row is selectable. Three kinds of row are plain text rather than links:
* **The shaded summary rows:** **Tokens in logs**, **Tokens indexed**, and **Kept** are totals rather than problems, so there is nothing to sample.
* **Duplicate event ID and Missing event ID:** Vantage does not retain sample records for these two, so they are never links even when they carry tokens.
* **Any disposition with zero tokens:** There is nothing to show.
If a disposition is a link but the dialog displays `No examples were recorded for this disposition.`, no samples were captured for it during that run. `Examples could not be loaded. Try again.` means the samples could not be fetched; reopen the dialog to retry.
### Join Key Format
In join samples, `model` is the **join key**, not just a model name. It packs together every dimension that both sides must agree on before usage can attach to a cost row, so it can look unfamiliar at first.
* For AWS Bedrock, the key is `region|operation|inference_scope|tier|model`, and `*` means "any value." So `*|*|*|standard|openai.gpt-5.6-luna` reads as: the model `openai.gpt-5.6-luna`, at standard (non-batch) tier, with no Region, operation, or inference profile reported by the logs, so any of those on the bill can match.
* For OpenAI, the key is `tier:model`, or `tier:regional:model` for regional-endpoint traffic. So `default:gpt-4o` is `gpt-4o` on the default service tier.
The part after the last separator is the normalized model. Everything before it is a qualifier, and a wildcard qualifier means your logs did not report that dimension. Sending those fields on your telemetry produces more precise attribution.
## Troubleshoot Using Import History
Use this table to turn what you see on the screen into a next step.
| What You See | Most Likely Cause | What To Do |
| ----------------------------------------------------- | --------------------------------------------------------------------------------------- | --------------------------------------------------------------------------------------------------------------------------------------------------------------------------------------- |
| Status is **No logs** for recent periods | Logs are not reaching the connected bucket, or are not in the expected path layout | Confirm your delivery pipeline is writing objects, then re-check the bucket and path in your integration's troubleshooting section |
| Status is **Error** | The source hit a failure | Open the sources table on the integration page to read the failure reason, then match it to your integration's troubleshooting section |
| **Log Lines Kept** is low | Malformed log records or missing required fields | On the Token Metrics screen, select the largest disposition in the **Log Scan** section to see its samples. See [Log Scan dispositions](#log-scan-dispositions) for what each one means |
| **Tokens Kept** is low but **Log Lines Kept** is high | Your logs are fine but do not line up with the bill | Open Token Metrics and read the [Join dispositions](#join-dispositions) |
| **Bill Match** is low | Your logs cover only part of the traffic on that bill | Confirm every application and Region that calls the provider is emitting logs |
| Large **No matching bill row** | Model names in your logs do not correspond to billed models, or the bill has not landed | On the Token Metrics screen, select **No matching bill row** to see which models are unmatched; recheck after the next data refresh |
| Large **Ambiguous sibling withheld** | Several cost integrations share one bucket without account identifiers | Add `resource_account_id` to your records or split the buckets |
| Large **Bill demand short of log usage** | Logs counted more usage than the provider billed | No action needed; totals still reconcile |
## Provider-Specific Troubleshooting
For setup and permission error messages, and for the case where costs are not split at all, see the Troubleshooting section on your integration's page.
Troubleshooting for common-schema telemetry sources.
Troubleshooting for Cloudflare AI Gateway Logpush sources.
Troubleshooting for Model Invocation Log sources.