> ## Documentation Index
> Fetch the complete documentation index at: https://docs.vantage.sh/llms.txt
> Use this file to discover all available pages before exploring further.
# Dashboards
> Create customizable dashboards in Vantage to visualize and compare cloud cost data across multiple reports.
Dashboards contain widgets, like reports. You can apply date range and period filters (e.g., display daily costs) to all reports on the dashboard. A consistent date range across all reports on the dashboard can help with cost comparison between different reports. Once a dashboard is created, you can customize the widgets on your dashboard according to your preferences.
To get started with dashboards, you can also watch these video demos on [Vantage University](/vantage_university_cost_reporting) .
You can add the following widget types to dashboards:
## Create a Dashboard
From the top navigation, click **Reporting**.
On the left menu, select **Dashboards**. All existing dashboards are displayed within this view.
Click **+ New Dashboard**.
Enter a **Name**.
Under **Widget Settings**, select the widgets you want displayed on the dashboard. Widgets are initially added to dashboards in chronological order, with the most recently added widget appearing at the bottom.
At this time, you cannot add widgets from the Overview page, such as **Provider Summary**.
Click **Save**.
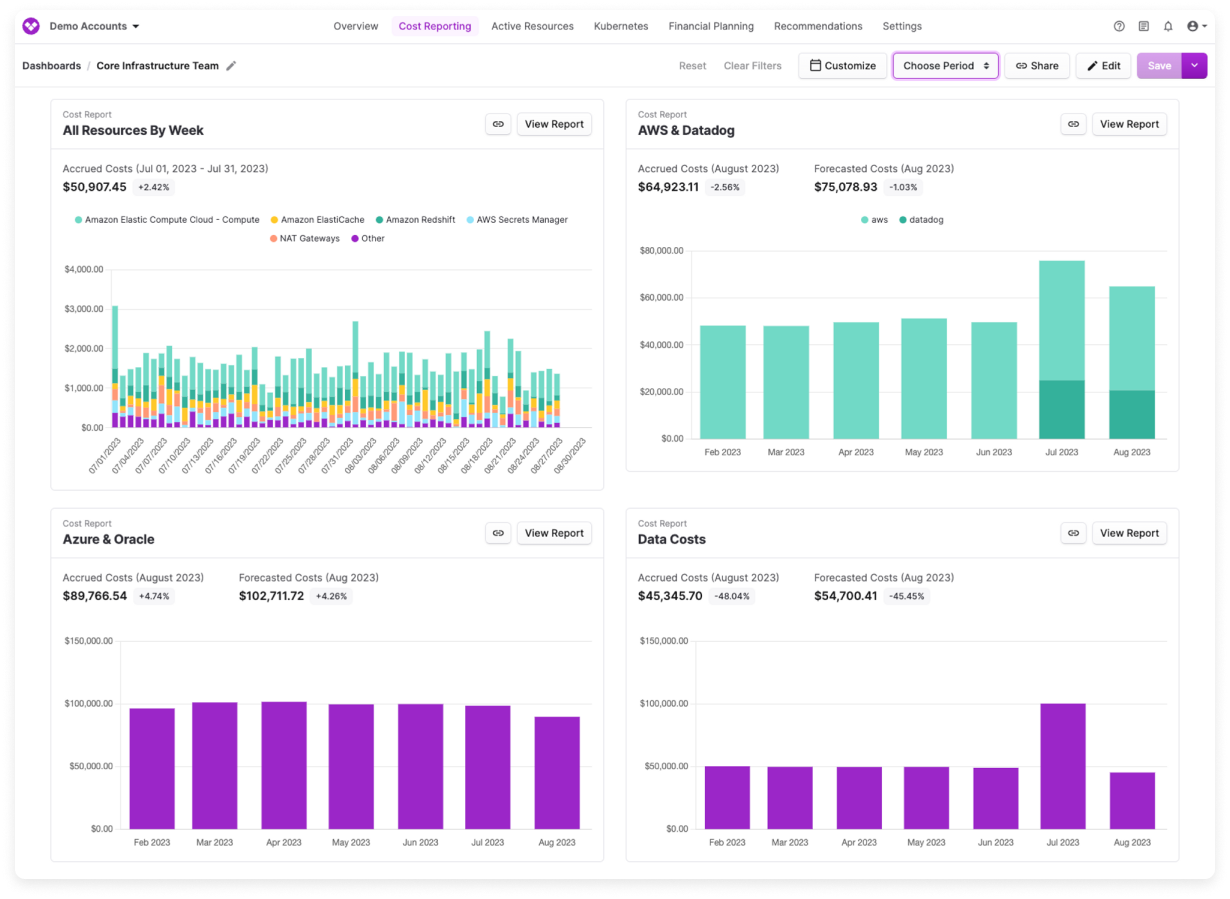
For each displayed report, click **View Report** to open that report in a new tab.
### Save a Dashboard to Favorites
To save a dashboard to your favorites, navigate to the [Dashboards](https://console.vantage.sh/dashboards) page, then click the star icon to the right of the dashboard's name. Access your starred dashboard from the **Starred By Me** screen in the left navigation. Dashboards you create are also displayed on the **Created By Me** screen.
### Delete a Dashboard
To delete a dashboard, navigate to the [Dashboards](https://console.vantage.sh/dashboards) page, then click the ellipses to the right of the dashboard's name. Click **Delete**.
## Customize a Dashboard
On the dashboard, you can apply the following customizations:
* To change the date range of all displayed reports, click the date picker on the right of the screen. Select a date range and click **Apply**. On the top right, click **Save Filters** to keep these settings. Click **Clear Filters** on the top left to remove filter updates.
* To change the date grouping, click the date bin menu on the top right. Select either **Cumulative**, **Monthly**, **Weekly**, or **Daily**. On the top right, click **Save Filters** to keep these settings. Click **Clear Filters** on the top left to remove filter updates.
* To create a new dashboard based on an existing dashboard, click the down arrow next to **Save Filters**. Then, click **Save as New**. You can then enter a new dashboard name and add additional customizations.
* To reset each widget back to its original settings, click **Reset**.
* To add more widgets to the dashboard or change the dashboard's name, click the pencil icon on the top right of the dashboard. Edit the dashboard and save.
These customization options do not apply to [folder dashboards](/folders#create-a-dashboard-from-a-folder), which are designed to be a read-only one-to-one representation of the resources within a folder. These customization options also do not apply to the **Overview** page.
### Edit Widget Name and Type
You can edit the widget type to display as a chart or table. The following widget types are available for the reports listed below.
| Widget Type | Chart View | Table View |
| ----------------------------- | ------------------------------------------------------------- | ------------------------------------------------------------- |
| Cost Reports | | |
| Usage Reports | | |
| Resource Reports | | |
| Kubernetes Efficiency Reports | | |
| Financial Commitment Reports | | |
| Saved Recommendation Views | | |
From any widget on a dashboard, click the pencil icon.
The widget edit slideout is displayed on the right side of the screen.
* To change the widget type, under **Default Widget State** select either **Chart** or **Table**. The widget type is automatically updated.
* To change the widget's name, click the pencil icon next to the current widget name in the slideout and update the name.
### Edit Dashboard Widget Order
You can edit the widget order that's displayed on a dashboard. You can edit the order directly on the dashboard or through the dashboard edit screen.
From the top right of a dashboard, click the **Reorder Widgets** icon (looks like a set of six dots).
Hover over and select any widget. Drag the widget to a new spot on the dashboard.
At the top, click **Done Reordering**. The new order is displayed on your dashboard.
From the top right of a dashboard, click the pencil icon.
The list of reports on the dashboard is displayed. Click **Reorder**.
Move the tile for each report up or down to change its order on the dashboard.
When you are finished, click **Done Reordering** > **Save**. The new order is displayed on your dashboard.
### Duplicate Widgets
You can duplicate a widget on a dashboard to create a copy with the same report and display settings. The duplicated widget is inserted directly after the original.
From any widget on a dashboard, click the pencil icon to open the widget edit slideout.
In the slideout, click the **Duplicate widget** icon (copy icon) at the top.
The duplicated widget is added to the dashboard immediately after the original. You can then edit its [name or display settings](/dashboards#edit-widget-name-and-type) independently.
From the top right of a dashboard, click the pencil icon to open the edit screen.
In the widget list, click the **Duplicate widget** icon (copy icon) next to the widget you want to duplicate.
The duplicated widget is added to the list. A **Duplicate** badge is displayed next to widgets that share the same report. Click **Save** to apply your changes.
Duplicating a widget is useful when you want to show the same report with different display settings (e.g., one as a chart and one as a table) on the same dashboard. Dashboards have a limit of 50 widgets.
## Add a Saved Filter to a Dashboard
You can use [saved filters](/saved_filters) to apply consistent filter logic to multiple Cost Reports on a dashboard. If you have a dashboard of high-level Cost Reports (e.g., filtered only to connected providers or services), and you want to further filter a dashboard to a team or specific category, you can use saved filters on dashboards to quickly apply this logic.
From the top right of any dashboard, click the **Saved Filters** dropdown menu.
Select one or more saved filters. The filter logic is applied across all Cost Reports on the dashboard.
When you add a saved filter to a dashboard, if a preexisting filter on a Cost Report and the saved filter use the same provider (e.g., both use AWS), "AND" logic is used between each filter set (i.e., show costs where the preexisting filter AND saved filter are true). If the preexisting filter and saved filter use different providers, "OR" logic is used between each filter set.
## Set a Default Dashboard
You can set a default dashboard that's displayed when a user logs in to Vantage and visits `console.vantage.sh`, instead of the [Overview](/overview) screen. This default dashboard can be set for a team or by an individual user. When the user logs in to Vantage, they will be redirected to that dashboard, and will be in the [workspace](/workspaces) that is associated with that dashboard.
* If a user is a member of a team with a configured default dashboard and also has a personal dashboard configured, the personal dashboard is displayed.
* If a user is a member of two different teams with configured default dashboards, the user will see the default dashboard of the first team they were added to.
A user with [Organization Owner](/rbac) permissions can set a default dashboard for a team.
From the top navigation, click **Settings**.
From the left navigation, under **General Settings**, click **Teams**.
Under **Default Dashboard**, select the dashboard that should be displayed when a member of the team visits `console.vantage.sh`. If you want to remove the default dashboard and display the Overview page instead, select **None**.
Click **Save**.
From the top navigation, click **Settings**.
From the left navigation, under **Personal Settings**, click **Profile**.
Under **Default Dashboard**, select the dashboard that should be displayed when you visit `console.vantage.sh`. If you want to remove the default dashboard and display the Overview page instead, select **None**.
A user can also select their personal default dashboard from any existing dashboard. At the top right of the dashboard, click the ellipses. Click **Set Default Dashboard** and confirm.
## Share a Dashboard
From the top of any dashboard, click the ellipses (**...**) icon, then click **Copy URL**. A link is added to your clipboard where you can share the dashboard with any Vantage user in your organization who has access to view the dashboard. Each widget on the dashboard also has a **Copy Link** option, with a unique link.
## Export Dashboards
You can create visual exports of any dashboard to share with stakeholders outside of Vantage. Dashboard exports are sent via email and include all widgets that can be added to dashboards.
* For table widgets, Vantage displays the first 12 rows to ensure readability and consistent layout across pages
* For more granular exports of tables, use [CSV exporting for each report](/cost_reports#export-cost-reports)
* Dashboards have a limit of 50 widgets, and the PDF will generate with the same number
* Dashboard exports use the date range currently displayed on screen (from the date picker). If you've changed the date range using the date picker but haven't saved the filters, the export will still reflect the date range you're currently viewing. You don't need to save the date range before exporting.
From any dashboard, click the ellipses icon in the top right corner.
From the dropdown, select **Export as PDF**.
Select the emails for any users you want to send the dashboard to.
Click **Export**. Vantage will generate a multi-page PDF with one widget per page. The export preserves chart filters, formatting, and the date range currently displayed on screen at the time of export.
## Dashboard Notifications
You can send automated email notifications of a dashboard to stakeholders on a daily, weekly, or monthly basis. Dashboard notifications include a snapshot of the dashboard at the time the email is sent. See the [Report Notifications](/report_notifications#set-up-dashboard-notifications) docs for more information about setting up dashboard notifications.