> ## Documentation Index
> Fetch the complete documentation index at: https://docs.vantage.sh/llms.txt
> Use this file to discover all available pages before exploring further.
# Cost Reports
> Learn how to configure Cost Reports in Vantage to analyze and optimize your cloud infrastructure spending across multiple providers.
By default, Vantage provides you with a Cost Report, named **All Resources**, that will show you all costs across all your connected cloud service accounts. You can create as many Cost Reports as you'd like and filter your costs across several dimensions. As you create Cost Reports, they will be displayed on the [Overview](/overview) page. Each report will automatically generate a [forecast](/forecasting).
To get started with Cost Reports, you can also watch these video demos on [Vantage University](/vantage_university_cost_reporting) .
If you want to create a custom table with specific columns, computed values, or calculations that are not available in Cost Reports, try [Canvas](/canvas).
## Create a Cost Report
From the top navigation, click **Reporting**.
On the left menu, select **Cost Reports**.
On the top right, click **+ New**. A new, unfiltered Cost Report is displayed.
From the top left of the graph, click **Filters**.
Click **+ Add a Filter** and select your desired filter criteria.
From the top right of the graph, use the date picker to select the date range for the report. You can select a date range that encompasses both previous and future dates, up to 6 months ahead. For more information on future forecast dates, see the [Forecasting](/forecasting) documentation.
For month- and week-based date ranges, an **Include Current Month** (or **Include Current Week**) toggle is available in the datepicker. By default, the toggle is on and the date range includes the current partial period—for example, "Last 3 Months" on March 24 shows January 1 through March 24. Turn the toggle off to constrain the range to only complete periods—"Last 3 Months" then shows December 1 through February 28. This toggle is hidden for day-based ranges like "Last 7 Days."
By default, the Cost Report compares the selected dates to the same previous period. For example, the default comparison date for March 12–March 18 is February 12–18. To select a **custom comparison**:
* Open the date picker menu.
* In the left column, select **Custom**.
* On the calendar section, select your desired date range. (The current month is selected by default.)
* Under **Comparing to Previous Period**, select the first date period field and select a custom comparison period.
* Click **Apply**.
* You can also enable or disable the previous period comparison on a report. Click the toggle next to the Previous Period on the Date Picker to toggle this setting on or off.
Select one of the following date bins:
* **Cumulative:** Displayed as a line, pie, or area chart on the graph, along with a forecast for line and area charts, if available. Also available as ungrouped bar charts.
* **Daily, Weekly, Monthly, or Quarterly:** Displayed as a bar (multi-bar and stacked options), line, or area chart, with date ranges binned on the bottom axis and a forecast, if available.
Quarters are based on the below ranges:
* Q1: January 1–March 31
* Q2: April 1–June 30
* Q3: July 1–September 30
* Q4: October 1–December 31
You can perform additional filter and analysis operations on your Cost Report. See the following sections for additional instructions:
### Save a Cost Report
After you apply all desired filters to the report, you can save your changes and name the report.
From the top right of the graph, click **Save As New** to create a new Cost Report with your changes, or **Save Changes** to modify the current report.
Enter a name, then click **Save**.
If you update the date range, date bin (e.g., **Last 30 Days**), or grouping, you can also permanently save these changes. Once saved, the new date range, date bucket, and grouping will persist on the [Overview](/overview) page. If you save a report that includes only changes to filter sets, the report will be displayed on the Overview page with the last six months of costs.
If you want to create a new report based on an existing report, open the existing report and click **Save as New** on the top right of the screen. You can then further refine your report criteria on the new report.
#### Save as Default
On the default **All Resources** Cost Report, users with the [Organization Owner](/rbac#understanding-rbac-roles) role can save the current settings as the workspace default. This changes the baseline view that all users in the workspace see when they open the All Resources report.
The **Save as Default** option appears in the split save button dropdown on the default report. It is disabled until you change at least one of the following settings from the current default:
* Chart type (e.g., line, bar, area)
* Date bucket (e.g., daily, monthly, cumulative)
* Date interval (e.g., last 3 months, last 30 days)
* Include Current Month/Week toggle
* Credits, discounts, refunds, and tax settings
* Amortization
* Start and end dates (for custom date ranges)
Once you change a setting, the option becomes active. Click **Save as Default** and confirm in the modal to apply. The updated defaults persist for all users in the workspace.
**Save as Default** is only available on the workspace's default All Resources report. It does not appear on custom reports, new unsaved reports, or Segment Reports.
### Organize Cost Reports
#### Cost Report Folders
You can organize your Cost Reports in folders and separate them by team or group. See the [Folders](/folders) documentation for more information.
#### Dashboards
Cost Reports can be displayed as a group on a dashboard. The dashboard has options to display all reports by the same date range. See the [Dashboards](/dashboards) documentation for more information.
### Anomalies, Forecasts, and Annotations
Cost Reports have several other features, including [anomaly detection](/cost_anomaly_alerts), [forecasts](/forecasting), and [annotations](/annotations). See the linked documentation for more information about these features.
### Forecasts Tab
The **Forecasts** tab on Cost Reports provides a dedicated interface for analyzing and comparing different forecast types—dynamic or baseline. This tab displays tabular views of each forecast type, historical differential analysis, and allows you to select which forecast to display on the chart. See the [Forecasting](/forecasting#dynamic-forecast) documentation for more details.
## Filter Cost Reports
On the **Filters** menu, click **Select a provider** and choose from any of your connected providers (AWS, Azure, etc.), or select **All Providers** to filter across every connected provider in a single filter set.
When you select **All Providers**, the labels shown in the filter dropdown depend on which providers you have connected:
* If you have one provider connected, or every connected provider uses the same label for a dimension, the dropdown shows that label.
* If your connected providers use different labels for the same dimension, the dropdown falls back to AWS-style labels (for example, **Billing Account** appears in place of Azure's **Subscription** or Oracle's **Tenancy**).
If you can't find a provider-specific label you're expecting:
1. Open the [Data Dictionary](/data_dictionary) and find your provider's section.
2. In the **Filter** column, find the label you're looking for and note its **API Field Name** (for example, Azure **Subscription** maps to `costs.provider_account_id`).
3. Look up that same API Field Name in the [AWS section](/data_dictionary#aws) to find the AWS-style label (for example, `costs.provider_account_id` is **Billing Account** on AWS).
4. In the **All Providers** filter dropdown, select that label and enter your value.
* When you select a single provider, costs are filtered to all costs for that provider. Within the table, costs are grouped by provider service (e.g., Amazon Relational Database Service), in descending order of **Accrued Costs**.
* To view available filter options, click **New Rule**. A list of filter options is displayed (e.g., Account). Filter options vary per provider. When **All Providers** is selected, only filter options that exist for every provider (e.g., Service, Account, Region, Tag) are available.
* Each filter includes options for exact matching and fuzzy matching. For example, in the image below, you can select **is**, **is not**, **contains**, **does not contain**, **starts with**, and **ends with** for the **Resource** filter. This set of options can vary per selected filter. Select a matching option, then select a filter value (e.g., where **Service** is **Amazon Relational Database Service** + **Amazon Elastic Compute Cloud - Compute**).
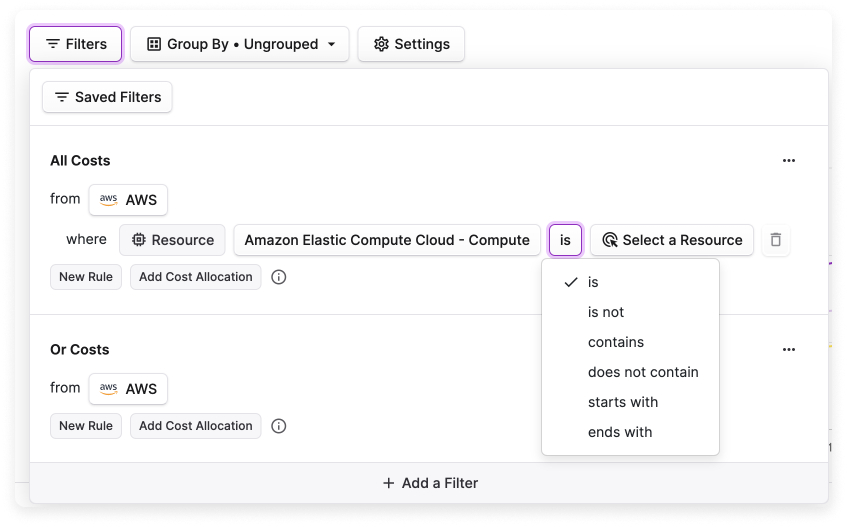
To continue filtering the report, perform any of the following actions:
* To add another value for that filter, click the **+** icon next to the first value.
* To remove a selected filter value, click the trashcan icon next to the value.
* To add more filter criteria, click **New Rule**. The graph is updated to display costs that match the first filter criteria *and* the second filter criteria.
* To add a separate filter set, click **+ Add a Filter**. You can also use this option to add costs from another provider. The graph is updated to display costs that match the first filter set *or* the second filter set.
* To remove a filter set, click the trashcan icon at the top of a filter set.
When filtering by **Category**, **Subcategory**, or **Resource**, the dropdown includes an **All** option. Select this option to filter across all services for the selected provider, without scoping to a specific service. In [VQL](/vql_cost_report#costs-by-specific-category), use `costs.service = '*'` as the service value to achieve the same result.
Filter values on Cost Reports are case-sensitive, except where you explicitly opt in to case-insensitive matching. Use the [**Flexible Match**](#flexible-match) operator on tag filters to ignore differences in case, whitespace, underscores, and hyphens. For other filter types, enter values exactly as they appear in your provider's billing data (for example, `ExtendedSupport`, not `extendedsupport` or `Extended Support`).
### Flexible Match
The flexible match operator in Vantage helps you work with inconsistent tag naming conventions. When filtering a Cost Report, you can select the flexible match operator to ignore differences in case, whitespace, underscores, and hyphens. This allows a single filter to match many tag value variations without creating multiple filters or manually normalizing tags.
For example, your organization tags workloads by team, but the tag values vary: one service might use `teamA`, another `team-a`, and a third `Team A`. Instead of creating separate filters for each variant, use the flexible match operator as shown in the image below.
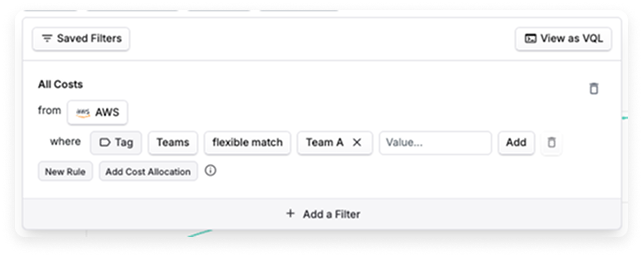
Vantage automatically normalizes and matches all variations, as well as matching any future iterations that are created of the `Team A` string.
To exclude values, use the **does not flexible match** operator.
### Percent-Based Cost Allocation
With percent-based cost allocation, you can filter Cost Reports to show back shared resources, like support costs or multi-tenant databases, to the team or department that uses them. As filters are set in a Cost Report, Vantage will query for costs that meet all those conditions.
To set percent-based cost allocation:
From the **Filters** menu, select your desired filter criteria. For example, select the **AWS** provider option and filter by **Service** for only RDS costs.
Click the **Add Cost Allocation** button on the filter set and enter a value between 1 and 100%. The set percentage will be applied to all the matching costs and represented accordingly in the Cost Report.
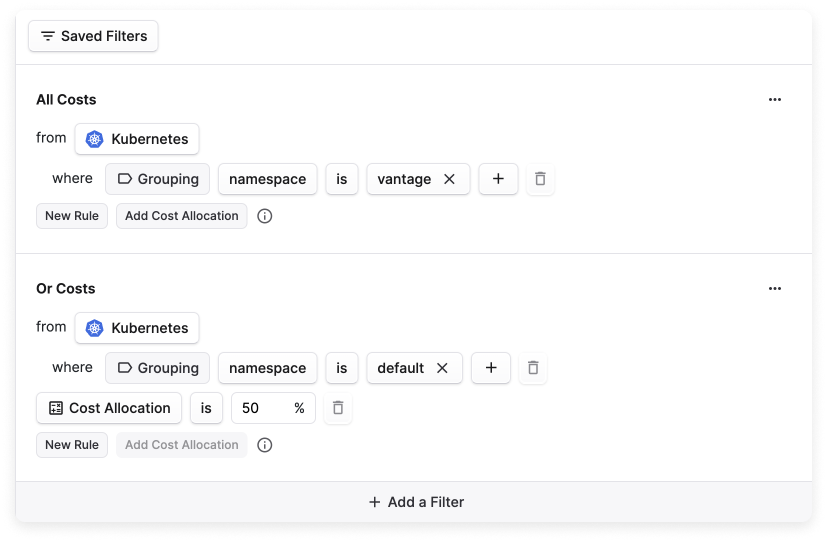
When percent-based cost allocation is set as a filter, forecasts will be produced in aggregate for all set conditions, and the percentage allocation will be applied to that forecast.
### Amazon Elastic Container Service (ECS)-Managed Tags
If you want to view Amazon Elastic Container Service (ECS) cluster tags, you need to enable ECS-Managed Tags. See the [AWS documentation](https://docs.aws.amazon.com/AmazonECS/latest/developerguide/ecs-using-tags.html#managed-tags) for more information.
### AWS Organization Tags
You can filter and group by [AWS Organization Tags](https://docs.aws.amazon.com/organizations/latest/userguide/orgs_tagging.html) in Cost Reports. Create a filter for **Tag**. For the **Tag Key**, these tags are displayed like `aws:organizations:tag`.
### Network Costs
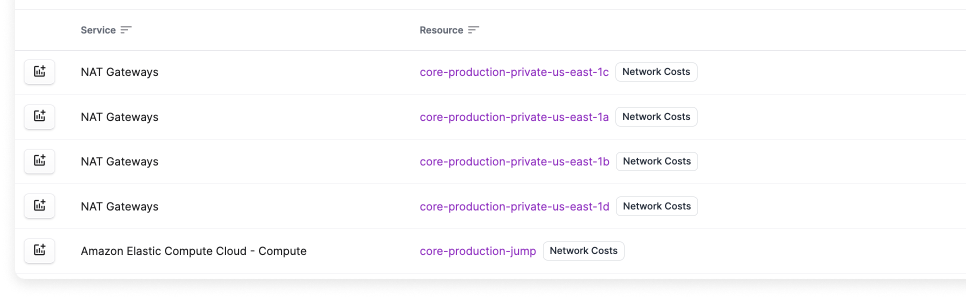
For resources that generate network traffic costs (e.g., NAT Gateways), a **Network Costs** button is displayed in the Cost Report list. See the [Network Flow Reports documentation](/network_flow_reports) for details on network costs.
In the below example, this Cost Report is grouped by **Service** and **Resource**. The **Network Costs** button is displayed next to NAT Gateway resources.
### Edit Filters as VQL
You can view and edit your Cost Report filters as [VQL (Vantage Query Language)](/vql) directly in the console. This is useful for making precise adjustments to complex filters, copying filter logic between reports, or reusing VQL across the API, Terraform, and Virtual Tags.
From the **Filters** menu, click **View as VQL** to see the current filter as a VQL query. Click **Edit VQL** to modify the query directly, then click **Apply** to update the filter. See the [VQL documentation](/vql#edit-vql-in-the-console) for details.
### Saved Filters
You can create and use **Saved Filters** to apply commonly used filters across multiple reports. Review the [Saved Filters documentation](/saved_filters) for more information.
## Configure Report Groups
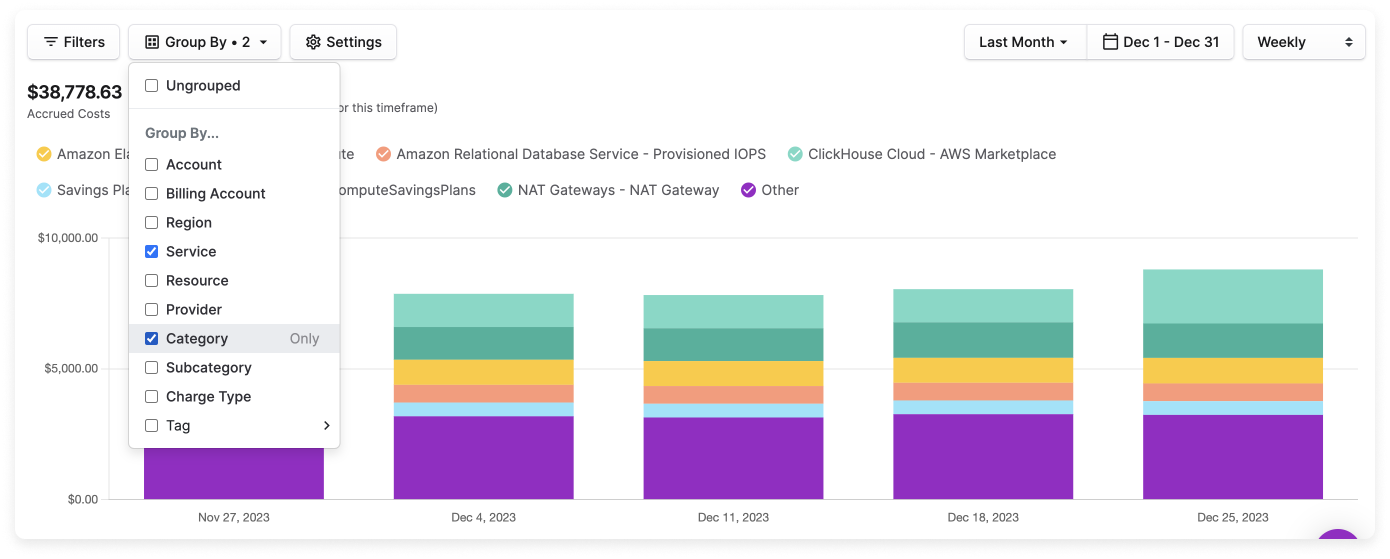
With the **Group By** option, you can select one or more dimensions to group by. If you select a grouping option, both the Cost Report table and graph will include costs aggregated by the selected groupings. Once the report is saved, the report’s corresponding [Overview](/overview) widget will be updated as well.
You can group by the following dimensions:
* Account (e.g., member account on AWS, project on GCP)
* Billing Account
* Region
* Service (e.g., Amazon S3, Azure VMs)
* Resource
* Provider (e.g., AWS, GCP, Azure)
* Category
* Subcategory
* Charge Type (see the [section below](/cost_reports#charge-type-grouping-category) for definitions)
* Tagged (e.g., see whether resources are or are not tagged)
* Tag (includes [virtual tags](/tagging))
After a Cost Report has been grouped, each grouping is displayed as a column in the table below the graph. On the graph itself, group labels are displayed with dashes between each grouping, such as `production - Acme - nat-123456`.
When you group by **Resource**, some cost line items may appear as **No Resource**. This means the cloud provider's billing data does not include a resource identifier for those costs. Common examples include tax line items, support charges, account-level fees (such as Enterprise Support or Shield Advanced subscriptions), certain data transfer costs, and some marketplace subscription fees. The same behavior applies to other grouping dimensions—for example, costs without a region will appear as **No Region**, and costs without a tag will appear as **Not tagged with \{tag name}**.
When grouping by tags that use [cost allocation](/tagging#cost-allocation-tags) (Business Metrics-Based, Cost-Based, or Percent-Based allocation tags), allocations that are individually less than 0.01% of the total are automatically grouped together and displayed as **other allocations (≤ 0.01%/each)**. This helps simplify reports by consolidating many small allocations into a single category. See the [Small Allocation Grouping](/tagging#small-allocation-grouping) section in the Tagging documentation for more details.
To sort the table by multiple columns in the table, press **Shift + Click** on the column headers.
### Charge Type Grouping Category
The Charge Type grouping includes costs separated by items like usage, discounts, EDP discounts, and taxes. Expand the section below to view the associated providers and definitions for each charge type.
| Charge Type | Provider | Definition |
| ---------------------------------------- | --------------------------------------------------------- | ----------------------------------------------------------------------------------------------------------------------------------------------------------------------------------------------------------------------------------------------------------------------------------------------------------------- |
| adjustment | GCP | GCP adjustments due to reasons like goodwill or SLA violations |
| AllocatedAmortizedDiscount | AWS | Savings from commitment-based pricing (Savings Plans/RIs) allocated to the account consuming the commitment. Appears as a negative amount, reducing the effective cost from on-demand pricing to the commitment rate. |
| AllocatedAmortizedFee | AWS | Savings Plans and Reserved Instances that have been amortized and allocated to an account with usage. This value can appear as a negative cost in the payer account because it is subtracted from the payer account and added to a member account. |
| AmortizedCredit | Via [Custom Providers](/connecting_custom_providers) | Credit charges that span multiple billing days, amortized across the covered period. Visible when amortization is enabled. |
| AmortizedDiscount | AWS | The discount portion of a commitment fee (Reserved Instance or Savings Plan upfront fee) that has been spread across the billing period. Represents the difference between the gross and net amortized upfront commitment cost. Visible when amortization and discounts are both enabled. |
| AmortizedFee | AWS | Amortized Savings Plan and Reserved Instance purchases |
| AmortizedPurchase | Azure | Azure reservation and Savings Plan purchases from the amortized cost dataset. Visible when amortization is enabled. |
| AmortizedRefund | Via [Custom Providers](/connecting_custom_providers) | Refund charges that span multiple billing days, amortized across the covered period. Visible when amortization is enabled. |
| AmortizedTax | AWS | Tax charges (such as AWS Marketplace or Enterprise Support tax) that span multiple billing days, amortized across the covered period |
| AmortizedUsage | AWS, Azure | Usage charges in the amortized cost view. For AWS, commitment-covered usage (Savings Plans/RIs) rewritten to gross cost when blended commitment discounts are enabled. For Azure, usage charges from the amortized cost dataset, where reservation and Savings Plan purchases are spread across the usage period. |
| Bundled Discount | AWS | Discounted usage for one product/service based on the usage of another product/service |
| Credit | AWS | Any AWS credits that were applied to your bill |
| COMMITTED\_USAGE\_DISCOUNT | GCP | Compute Engine resource-based committed use discounts |
| COMMITTED\_USAGE\_DISCOUNT\_DOLLAR\_BASE | GCP | Spend-based committed use discounts |
| DISCOUNT | Any provider | Discounts applied by a provider for your usage |
| DistributorDiscount | AWS | Discounts through the [AWS Distribution Resellers Program](https://aws.amazon.com/partners/programs/distribution-resellers/) |
| Enterprise Discount Program Discount | AWS | Discounts applied through the [AWS Enterprise Discount Program (EDP)](https://aws.amazon.com/pricing/enterprise/) |
| Fee | AWS | Upfront annual fees paid for subscriptions, such as the fee paid for All Upfront subscriptions. Also used for AWS Marketplace and Support fees. |
| FeeTax | AWS | Tax related to "Fee" type charges, such as AWS Marketplace tax |
| FEE\_UTILIZATION\_OFFSET | GCP | Credit that offsets Committed Use Discount (CUD) fee SKUs when commitments are fully utilized, resulting in zero net cost for the fee SKU |
| FREE\_TIER | GCP | Credits applied related to GCP Free Tier usage |
| Monthly Minimum Fee | Fastly | Minimum fee for [Fastly](https://www.fastly.com/pricing) |
| PartnerEarnedCredit | Azure | Credits earned by [Cloud Solution Provider (CSP)](https://learn.microsoft.com/partner-center/billing/partner-earned-credit) partners for managing customer Azure resources. Visible when credits are included. |
| Private Rate Discount | AWS | AWS discount based on private pricing rates |
| PROMOTION | GCP | GCP promotional credits related to items like marketing promotions |
| Purchase | Azure | Azure Marketplace purchases |
| Refund | AWS | Negative charges, indicating money refunded by AWS |
| regular | GCP | GCP regular charges |
| RESELLER\_MARGIN | GCP | Discounts for [GCP Reseller Program](https://cloud.google.com/marketplace/docs/partners/resell/reseller-incentives) |
| Reserved Instance Discounted Spend | AWS | The rate for instances benefiting from Reserved Instance (RI) benefits |
| Reserved Instance Fee | AWS | Monthly recurring fees for Reserved Instance subscriptions |
| RiVolumeDiscount | AWS | Volume discounts for large Reserved Instance purchases |
| RoundingAdjustment | Azure | Small adjustments for rounding differences in Azure billing calculations |
| rounding\_error | GCP | GCP cost type for rounding errors |
| Savings Plan Discounted Spend | AWS | On-demand costs covered by your Savings Plan, offsetting corresponding Savings Plan negation items |
| Savings Plan Negation | AWS | Offset costs through your Savings Plan benefit associated with covered usage items |
| Savings Plan Recurring Fee | AWS | Hourly recurring charges associated with a No Upfront or Partial Upfront Savings Plan |
| Savings Plan Upfront Fee | AWS | One-time upfront fee from purchasing All Upfront or Partial Upfront Savings Plans |
| Solution Provider Program Discount | AWS | Discounts through the [AWS Solution Provider Program](https://aws.amazon.com/partners/programs/solution-provider/) |
| SppDiscount | AWS | Solution Provider Program discount (internal charge type name used in billing rules) |
| SUBSCRIPTION\_BENEFIT | GCP | Credits earned after purchase of long-term subscriptions |
| SUSTAINED\_USAGE\_DISCOUNT | GCP | Credit for running certain Compute Engine resources for a large portion of the month |
| Tax/tax | AWS, GCP | Taxes applied, such as sales tax |
| UnamortizedCredit | Via [Custom Providers](/connecting_custom_providers) | The original lump-sum credit charge before amortization. Visible when amortization is disabled. |
| UnamortizedDiscount | AWS | The discount portion of an unamortized commitment fee (Reserved Instance or Savings Plan). Visible when amortization is disabled and discounts are included. |
| UnamortizedFee | AWS, via [Custom Providers](/connecting_custom_providers) | The original lump-sum fee charge before amortization. For AWS, Savings Plan recurring fees shown as unamortized when blended commitment discounts are enabled. Visible when amortization is disabled. |
| UnamortizedPurchase | Azure | Azure reservation and Savings Plan purchases from the actual (unamortized) cost dataset. Visible when amortization is disabled. |
| UnamortizedRefund | Via [Custom Providers](/connecting_custom_providers) | The original lump-sum refund charge before amortization. Visible when amortization is disabled. |
| UnamortizedSppDiscount | AWS | Unamortized Solution Provider Program discount |
| UnamortizedTax | Via [Custom Providers](/connecting_custom_providers) | The original lump-sum tax charge before amortization. Visible when amortization is disabled and taxes are included. |
| UnamortizedUsage | Azure | Usage charges from the actual (unamortized) cost dataset, where reservation and Savings Plan purchases are shown as lump sums rather than spread over time. Visible when amortization is disabled. |
| UnusedReservation | Azure | Cost of [unused Azure reservation](https://learn.microsoft.com/azure/cost-management-billing/reservations/understand-reserved-instance-usage-ea) capacity. Represents reservation hours that were paid for but not utilized. Visible when amortization is enabled. |
| UnusedSavingsPlan | Azure | Cost of [unused Azure Savings Plan](https://learn.microsoft.com/azure/cost-management-billing/savings-plan/utilization-cost-reports) capacity. Represents Savings Plan commitment that was paid for but not utilized. Visible when amortization is enabled. |
| Usage | Any provider (for GCP, see "regular") | Charges for usage at regular or on-demand rates |
Each AWS discount type in the table above (such as Bundled Discount, Enterprise Discount Program Discount, and Private Rate Discount) also has amortized and unamortized variants that use the internal charge type name with a prefix—for example, `EdpDiscount` becomes `AmortizedEdpDiscount` or `UnamortizedEdpDiscount`.
* **Amortized variants** (e.g., `AmortizedEdpDiscount`) appear when amortization and discounts are both enabled. These represent the discount amount on fee rows (such as Marketplace or Enterprise Support charges) that have been spread across the billing period.
* **Unamortized variants** (e.g., `UnamortizedEdpDiscount`) appear when amortization is disabled and discounts are included. These represent the discount amount on unamortized fee or commitment rows, such as Reserved Instance fees or Savings Plan recurring fees.
The discount types with these variants are: `EdpDiscount`, `BundledDiscount`, `SppDiscount`, `RiVolumeDiscount`, `PrivateRateDiscount`, and `DistributorDiscount`.
To identify Savings Plan or Reserved Instance waste over time, create a Cost Report grouped by **Charge Type** with [amortization](/cost_reports#amortization) enabled and filter to show only `AmortizedFee` and `AllocatedAmortizedFee`. `AmortizedFee` represents your total commitment cost, while `AllocatedAmortizedFee` represents the portion allocated to accounts with actual usage. A gap between the two indicates unused commitment capacity. You can also use [Financial Commitment Reports](/financial_commitment_reports) to view coverage and utilization trends.
### Other Grouping Category
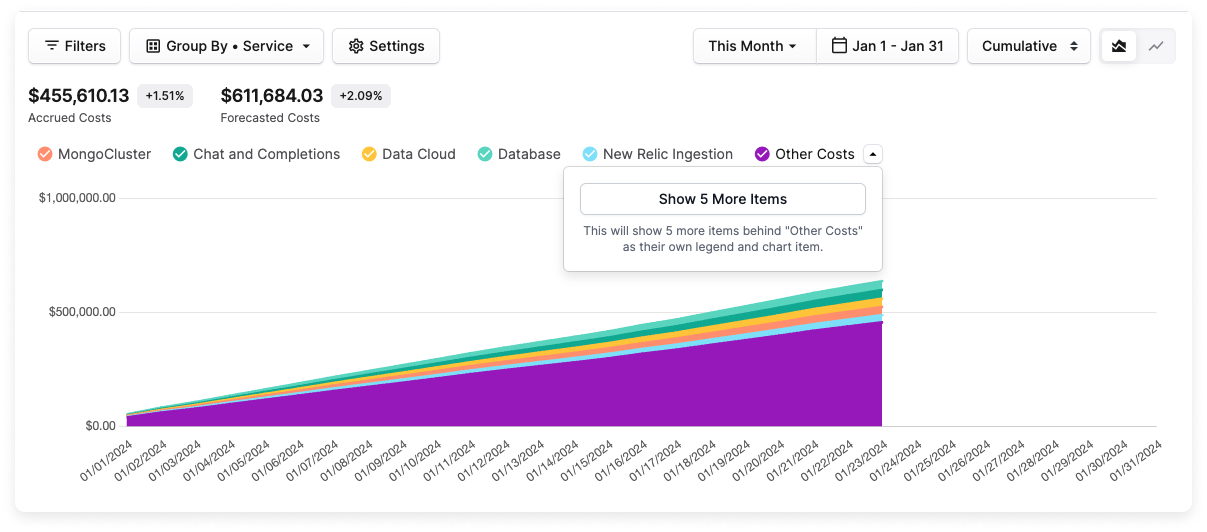
By default, the top five groups of costs by amount are displayed on the graph. In addition, the Other Costs category is displayed as an aggregation of all remaining costs. To add more costs to the graph and table, click the down arrow next to **Other Costs**. The number of other costs is displayed. Click **Show X More Items** to add additional cost groups to the report.
## Drill Down in Costs Table
Within the table below the graph, you can drill down into your report to create precise filtering and grouping views. When you click a drilldown icon on a row, Vantage automatically adds filters matching the values in that row and adds a grouping dimension to the report, allowing you to explore your costs in more detail.
Drilldown functionality is available in both the **Cumulative** and **By Date** views of the cost table. The drilldown options available depend on whether the report is currently ungrouped or has grouping criteria applied.
### Starting from an Ungrouped Report
When a Cost Report is ungrouped (i.e., the **Group By** dropdown is set to **Ungrouped**), two drilldown icons are displayed next to each service in the table:
* **Costs by Category** icon (shapes icon): Click to view costs broken down by category for that service. This adds a filter for the selected service and groups the report by **Category**.
* **Costs by Resource** icon (chip icon): Click to view costs broken down by individual resources for that service. This adds a filter for the selected service and groups the report by **Resource ID**. This option is only available for providers that support resource-level cost data, such as AWS.
In the example below, clicking the **Costs by Category** icon (shapes icon) next to EC2 breaks down the service costs by category, such as Data Transfer and Compute Instance.
Once you click a drilldown icon, the report becomes grouped and the drilldown options change. The next drilldown icon in Vantage's standard sequence then appears, allowing you to continue drilling down further. For example, after clicking **Costs by Category**, the report is grouped by **Category** and the **Costs by Subcategory** icon appears next to each category, allowing you to drill down to subcategory-level detail. You can also use the drilldown menu to choose from other available grouping dimensions, as explained in the next section.
### Starting from a Grouped Report
When you manually apply grouping criteria to a Cost Report (e.g., set the **Group By** field to **Service**), the following drilldown options are available:
* **Quick drilldown icon**: A single icon is displayed that represents the next grouping dimension in Vantage's standard drilldown sequence. For example, if you group by **Account**, the quick drilldown icon will drill down by **Billing Account**. Hover over the icon to see what grouping it will apply.
* **Drilldown menu**: A dropdown menu (filter list icon) appears next to the quick drilldown icon, allowing you to choose any available grouping dimension to drill into, rather than using the automatically determined next grouping.
When you click either the quick drilldown icon or select an option from the drilldown menu, Vantage:
* Adds filters matching the values in that row (e.g., the specific service, category, or other grouping values)
* Adds the selected grouping dimension to the report
* Displays the new grouping as a column in the table
In the below example:
* The report is filtered to **AWS** costs and grouped by **Service**.
* On the line item for **Elastic Compute Cloud - Compute**, click the quick drilldown icon (which drills down by **Category**).
* A filter for line items matching only the **Elastic Compute Cloud - Compute** service is added in the **Filters** menu.
* The report is now also grouped by **Category**.
* The **Category** column appears in the table.
* You can continue to click the quick drilldown icon on subsequent rows to drill deeper into your costs. Each click adds filters for the selected row and applies the next grouping in Vantage's standard sequence. For example, if you click the quick drilldown icon on the **EC2 > Data Transfer** line item:
* The **Data Transfer** category filter is applied in the **Filters** menu.
* The report is automatically grouped by **Subcategory** (the next grouping in the sequence after Category).
* **Subcategory** is also displayed as a column in the table.
* You can also use the **Drilldown menu** (the filter list icon) to choose which grouping dimension to drill into next, rather than using the automatically determined next grouping. In the below example, you select the **Region** option for the **EC2 > Data Transfer > EU-DataTransfer-Out-Bytes** line item. In the resulting report, **EC2 > Data Transfer > EU-DataTransfer-Out-Bytes** is broken down with individual line items per region.
* The additional filter for the **EU-DataTransfer-Out-Bytes** subcategory is added to the **Filters** menu.
* The report is now also grouped by **Region** (the selected grouping).
* **Region** is now a column in the table.
### Navigating Drilldown History
After drilling down into your costs, you can use the back button in your browser to navigate back to the previous drilldown level. This allows you to easily move between different levels of detail without losing your place in the report.
### Tagging Drilldown
When a tag is a [nested tag](/tagging#nested-virtual-tags), you can drill down into its values to view all subtags.
In the example below, the report is grouped by the nested tag **Business Units**. This tag contains two values—**Core Production** and **Core Development**—each made up of other tags.
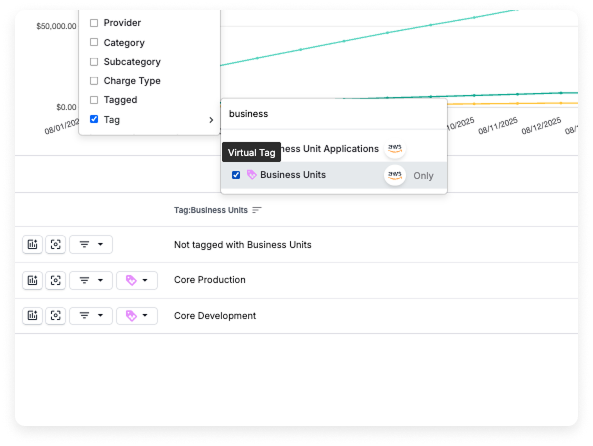
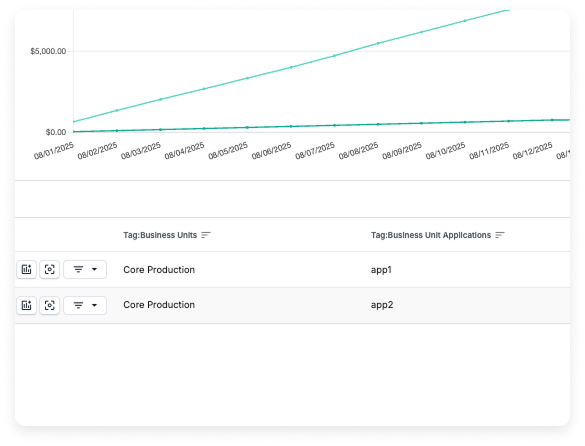
Click the drilldown tagging icon to the left of a tag name to reveal its nested values. For example, **Core Production** is the parent tag, with **Business Unit Applications** subtags **app1** and **app2**. The Cost Report table then shows costs associated with these lower-level tags.
## Billing Code Descriptions
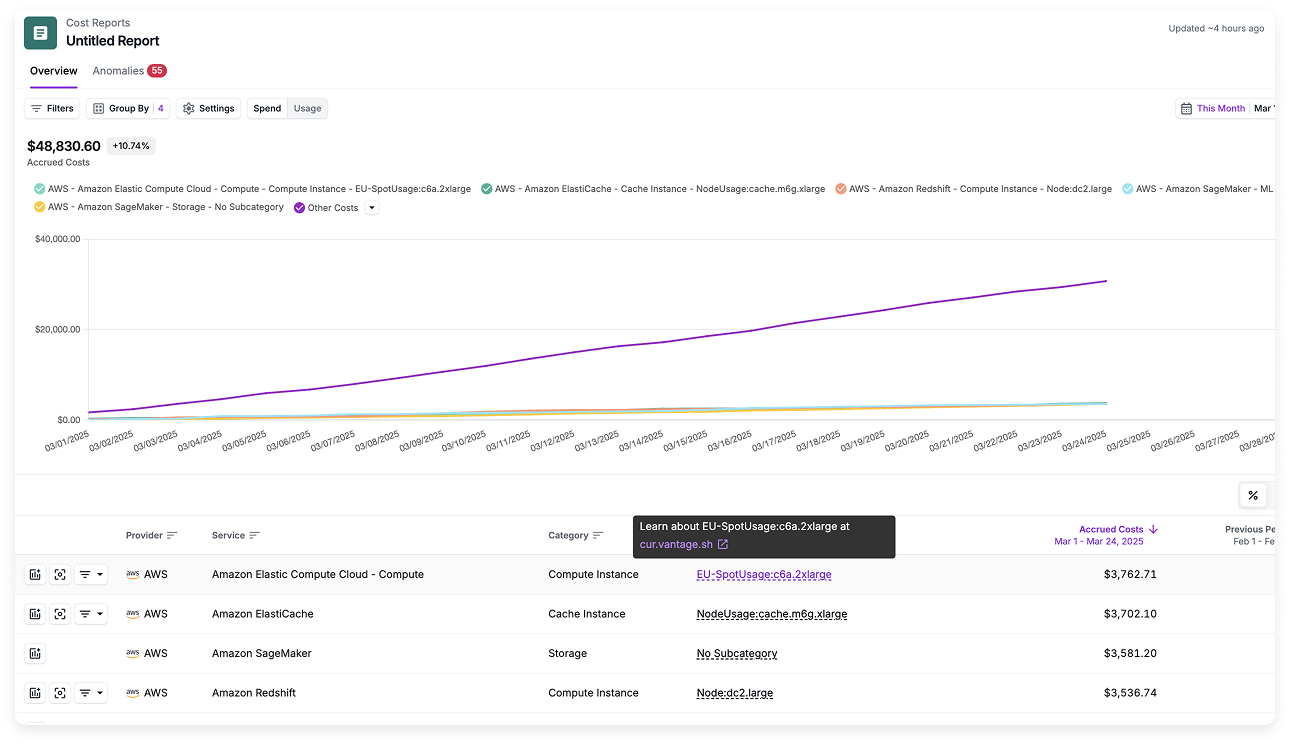
AWS practitioners who are having trouble understanding AWS billing codes present in Cost Reports can find descriptions of each billing code, other variations of that billing code, and other services that use the same billing code within Cost Reports. When you view any AWS Cost Report grouped by **Provider, Service, Category, and Subcategory**, you can hover over any subcategory line item and a tooltip with a link to [cur.vantage.sh](https://cur.vantage.sh/) is provided that takes you to a page with details for that billing line item.
[cur.vantage.sh](https://cur.vantage.sh/) is a free utility that gives cloud practitioners simple definitions of billing codes for every AWS service. The site has a distinct page for each AWS service (e.g., S3 or EC2) that clusters together similar billing codes for that service, as there may be separate or distinct billing codes for each individual region.
## Adjust Chart Visualization
You can adjust the chart to show as one of the below options. To toggle these options, click one of the corresponding buttons on the top right of the chart.
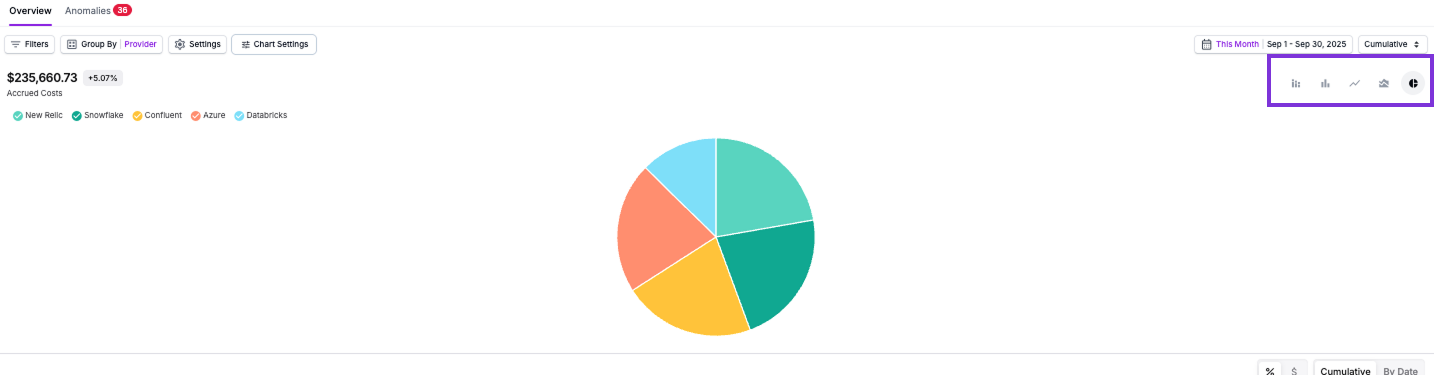
* **Stacked Bar**: Segmented bars stacked on top of each other. Each bar shows cumulative total with different colors for each grouping (e.g., when grouped by provider, one bar for AWS, one for Azure, etc.). Available with Daily, Weekly, Monthly, or Quarterly date bins.
* **Multi-Bar**: Separate bars for each segment side-by-side for easy comparison across categories at each time point. Available with Daily, Weekly, Monthly, or Quarterly date bins.
You can also see a cumulative view of bar charts when they are ungrouped. The cumulative view is not available for grouped bar charts.
**Best for**: Comparing values across different groupings.
* Cost trends over time as connected data points. Individual lines for each group. Available with Daily, Weekly, Monthly, Quarterly, and Cumulative date bins.
**Best for**: Identifying trends, seasonal patterns, and growth trajectories.
* Filled areas under lines, stacked on top of each other. Total cost height with colored areas showing each group's contribution. Available with Daily, Weekly, Monthly, Quarterly, and Cumulative date bins.
**Best for**: Visualizing both individual costs and proportions to total.
* Proportional breakdown at a single point in time. Circular chart with slices sized by cost grouping. Available with Cumulative date bin only.
**Best for**: Understanding cost distribution and identifying largest cost drivers.
## Configure the X Axis
By default, Cost Reports display the date on the X axis with costs segmented by provider, service, or other dimensions. You can also configure the X axis to show different dimensions, giving you more control over how costs are grouped and visualized.
The configurable X axis is compatible with bar charts—both multi-bar and stacked bar charts. If you want to change the chart type, you’ll be asked to confirm the change. If you proceed, the grouping will reset to by date.
When you change the X axis to a non-date dimension, any existing Group By settings will be removed, and you will be unable to set additional Group By settings, as the chart will now be grouped by time period. In addition, [annotations](/annotations) will not show in the chart itself; however, you can view your existing annotations by clicking on the **Annotations** icon in the top right of a Cost Report.
To configure the X axis:
Apply any desired filters to the chart.
Filters apply as normal. For example, you can filter a Cost Report to only AWS, then set the X axis to "Team" to compare team costs within AWS. The segmentation will always adjust to reflect the chosen X axis.
At the top of any Cost Report, select the **Chart Settings** dropdown.
Select your desired **X Axis Group By** dimension from the dropdown.
* **Date** (default)
* **Billing Account**
* **Linked Account**
* **Region**
* **Service**
* **Resource ID**
* **Provider**
* **Cost Category**
* **Cost Subcategory**
* **Charge Type**
* **Tagged Status**
* **Tag Key** (any available tag)
When you select a non-date dimension, the chart will update to show that dimension on the X axis, with date becoming the segmentation within the chart based on your selected date bin.
The maximum number of groupings on an X axis is 10 for multi-bar charts and 20 for stacked charts. All remaining items after these limits are aggregated into an "Other" bar. You can't select multiple dimensions (e.g., provider *and* tag) to display on the X axis. The X axis group order is descending based on cumulative spend.
## Configure Report Settings
### Credits, Discounts, Refunds, and Taxes
By default, all Cost Reports include discounts and taxes. You can optionally enable credits and refunds, too.
* **Credits:** Credits are often promotional codes redeemed for services or trials on your account.
* **Discounts:** Discounts can include programs like the AWS Enterprise Discount program. Discounts are often negotiated with the cloud provider and based on usage. You might see discounts reflected as negative values in the Cost Report table. You can follow the below best practices for analyzing Cost Reports with discounts:
* If you remove the **Discount** setting, you can view usage and costs *before* the discount was applied.
* Group or filter the Cost Report by **Charge Type**. This grouping displays costs separated by items like usage, discounts, EDP discounts, and taxes.
* **Refunds:** Any associated refunds.
* **Taxes:** Any associated taxes.
To configure these options:
Above the Cost Report graph, click **Cost Settings**.
Select an option to toggle on/off any of the included costs (e.g., discounts, etc.).
### Amortization
By default, all Cost Reports show upfront fees, such as fees for Reserved Instances, Savings Plans, Marketplace purchases, and Support, amortized day by day for the period of the fee.
In addition, Vantage uses committed use attribution for linked accounts. By default, you will see fees for Reserved Instances and Savings Plans assigned to the AWS account that *benefited* from the discount—not the account that purchased the commitment.
For more information about this logic, see the following [Vantage blog post](https://www.vantage.sh/blog/vantage-launches-committed-use-float-cost-attribution).
In contrast to AWS Cost Explorer, which displays fees associated with the account responsible for the commitment or purchase, Vantage provides a comprehensive view by showing fees based on the account where the benefits were realized.
#### Disabling Amortization
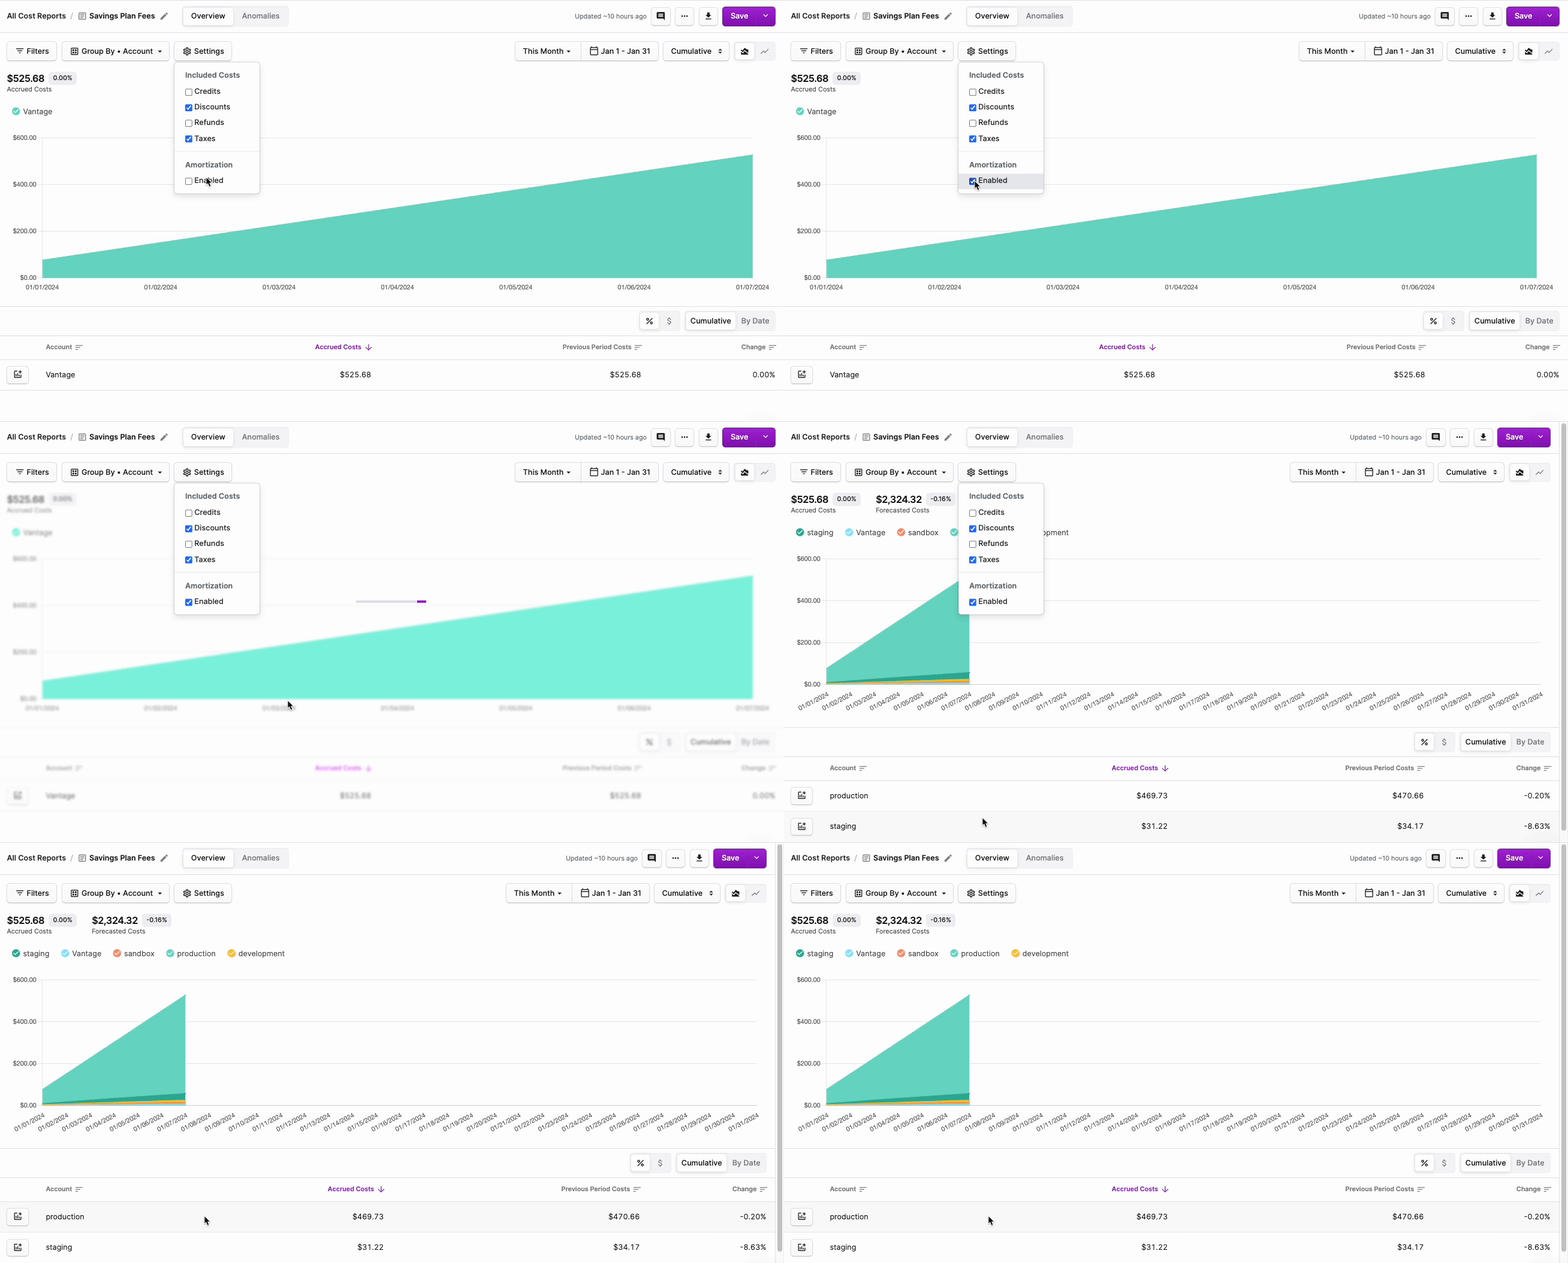
You can toggle a Cost Report to not amortize upfront fees if you want to view the upfront fees on the day they were incurred.
From the top of any Cost Report, click **Cost Settings**.
Under **Amortization**, uncheck **Enabled**.
#### AWS Blended Commitment Discounts
AWS Blended Commitment Discounts provide a way to evenly spread commitment-based discounts (from Savings Plans and Reserved Instances) to all eligible usage. Vantage calculates an effective savings rate per AWS service and applies it proportionally—so all teams and workloads receive consistent discounts, regardless of where AWS originally applied them.
To enable blended commitment discounts for your AWS integration, contact [support@vantage.sh](mailto:support@vantage.sh).
Customers who use AWS [discount sharing](https://docs.aws.amazon.com/awsaccountbilling/latest/aboutv2/ri-turn-off.html) across accounts can experience uneven distribution of Savings Plan and Reserved Instance discounts. Savings Plans apply discounts from the highest discount usage type to the lowest until the committed amount is consumed. This means that workloads with lower savings rates—such as Windows instances or workloads outside of US regions—rarely see discounts without purchasing dedicated Savings Plans in the accounts that consume them.
**How Vantage calculates blended discounts**
When enabled, Vantage computes an effective savings rate per AWS service across your entire commitment portfolio. For eligible usage, the blended discount amount is:
$\text{Blended Discount} = \text{Gross Usage Cost} \times \text{Effective Savings Rate (per service)}$
This rate is then applied proportionally to all eligible usage for that service, creating even discounts across all teams and workloads.
**What changes in your Cost Reports**
When you view a Cost Report with amortization and discounts enabled:
* Eligible commitment-covered usage is represented as `AmortizedUsage` at its **gross cost** (the on-demand price).
* A separate `AllocatedAmortizedDiscount` row is added as a **negative amount**, representing the blended savings.
* For eligible categories, separate discount line items (such as EDP or Private Rate Card discounts) are consolidated into the blended discount rather than shown individually.
The sum of `AmortizedUsage` and `AllocatedAmortizedDiscount` equals the net effective cost for that usage.
**What does not change**
* **Commitment fees:** Reserved Instance fees and Savings Plan recurring fees pass through as unamortized fees with any associated discounts shown as unamortized discounts.
* **Non-commitment fees:** Fees that span multiple days—such as Enterprise Support or Marketplace charges—continue to be amortized across the billing period as they are today.
* **Unamortized costs:** Unamortized costs, such as upfront fees or monthly commitment fees, are not affected.
* **Non-eligible usage:** For usage that is not eligible for commitment-based discounts, discount rows are still emitted individually.
* **Kubernetes efficiency:** For Kubernetes-related services, Vantage also computes and attaches a discounted rate based on the blended savings rate so that [Kubernetes efficiency](/kubernetes) calculations remain consistent.
This feature applies to all Cost Reports and Workspaces for the enabled AWS integration. It cannot be selectively applied to specific reports.
### Vantage vs. Cost Explorer
If you notice your costs in Vantage differ from what you see in Cost Explorer, this could be for many reasons, including:
* **Amortization logic:** As noted above, Vantage uses a different amortization logic from Cost Explorer.
If you want to align the view in Vantage to Cost Explorer, disable amortization in Vantage and compare the numbers to unblended costs in Cost Explorer.
* **EC2-Other:** In Cost Explorer, this cost category comprises many subcategories (e.g., Data Transfer). In Vantage, EC2-Other is reallocated into direct line items. For example, if you filter for NAT gateway expenditures, the charges initially categorized under transit or egress in EC2-Other are assigned to the individual resource that created the charge.
For more tips on reviewing your cost data against Cost Explorer, see [the following blog post](https://www.vantage.sh/blog/analyze-aws-cost-data).
### Usage-Based Reporting
Usage-Based Reporting provides infrastructure consumption in non-monetary metrics, such as virtual machine running hours, stored gigabytes of data, and read/write units consumed. These reports are available within Cost Reports, where you can toggle between viewing consumption by spend or by usage. See the [Usage-Based Reporting](/usage_based_reporting) documentation for details on how to use and view these reports.
## Comparative Cost Reporting
### Side-by-Side Comparison Charts
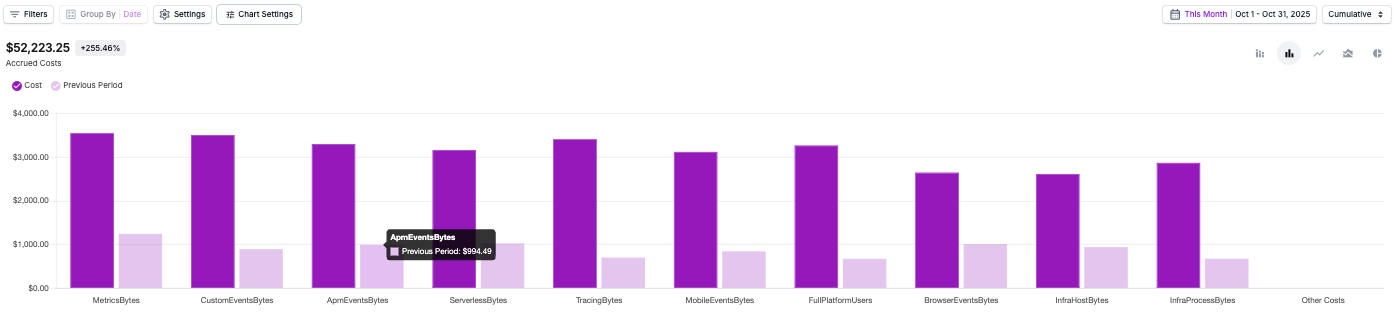
Create comparative Cost Reports by configuring the X axis to show different groupings (like region, service, or team) and using multi-bar charts. This displays current and previous period costs side-by-side for each grouping, making it easy to compare spending across different categories.
To create a comparative report:
Create a Cost Report with a multi-bar chart visualization.
Configure the X axis to group by your desired dimension (e.g., region, service).
The chart will automatically show current period and previous period bars for each grouping, allowing you to compare costs across different categories.
### Update the Costs Table
To compare costs day by day, week by week, month by month, or quarter by quarter on Cost Reports, click the **By Date** option above the cost table. A view of costs with the same date binning selected for the graph is displayed. To switch back to the previous, current, and percent change view, select **Cumulative**.
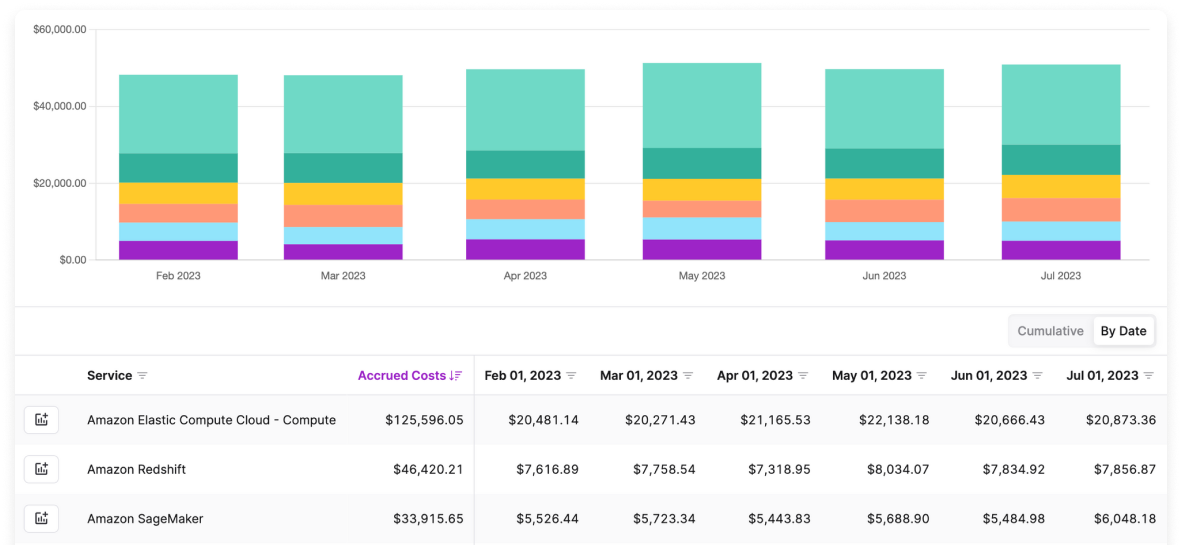
When you view the **By Date** option, a **Total Costs** row is displayed at the top of the table.
## Export Cost Reports
You can export Cost Reports as **CSV** or **PDF** files to share with other Vantage users. You can also create an export that includes both file formats. Reports with [Configurable X Axis settings](/cost_reports#configure-the-x-axis) can be exported just like any other report.
Export a Cost Report that matches your current filters, dimensions, and date range. To change dimensions, update the underlying report before exporting.
Use the Cost Report export flow when you want a point-in-time CSV (including CSVs in the FOCUS schema) or PDF file that matches the current report view. If you need recurring automation or want to retrieve cost data directly into your own systems, use the [Vantage API](/api) instead.
PDF exports include the following elements:
* Cost Report title
* Date range
* Link at the top to the associated Cost Report in Vantage
* Accrued costs represented in the Cost Report
* Color-coded legend for the Cost Report groupings
* Graphical representations of your Cost Report (supports all Vantage chart types)
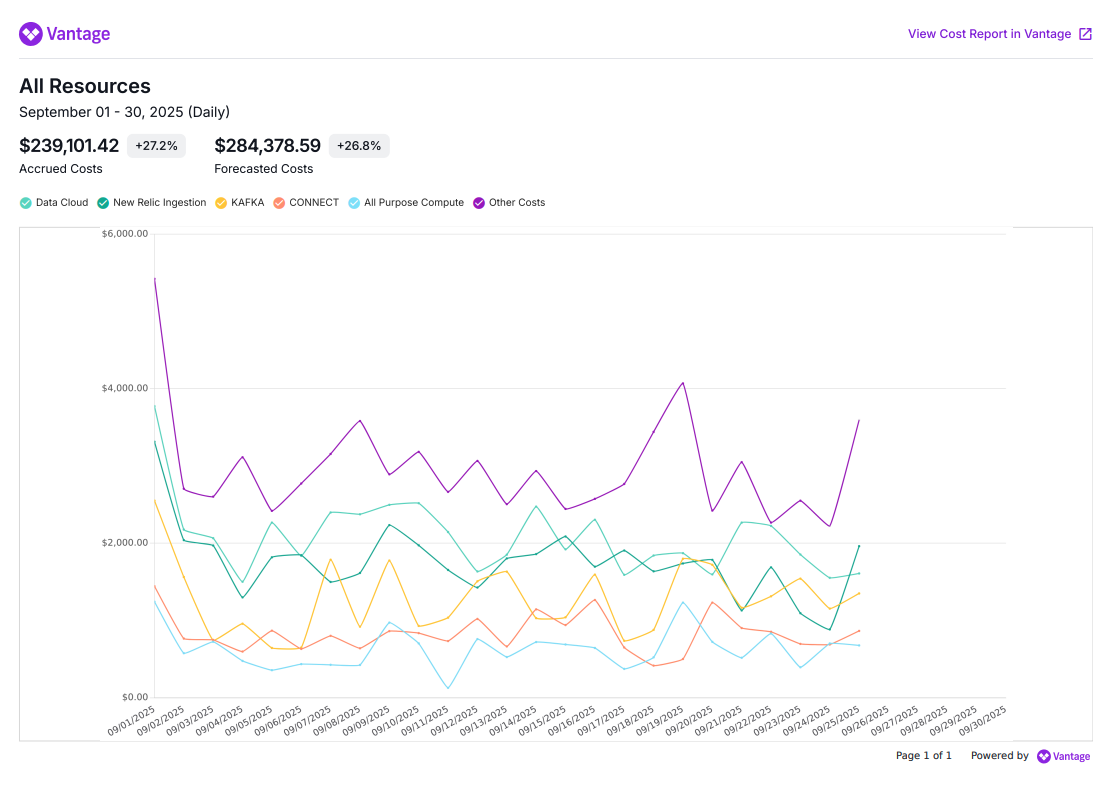
If your Cost Report has any associated business metrics, budgets, or a forecast, these elements will also be displayed.
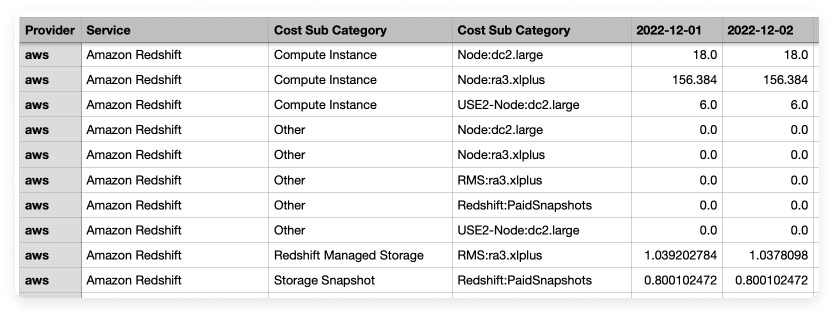
An example export, with groupings of Service **Category** and Service **Subcategory**, is shown below. You can also export grouped Cost Reports and the groupings will be respected in the downloaded CSV.
To export a Cost Report:
Open any Cost Report.
From the top right, click the download icon (looks like an arrow with a line below it).
The **Export Data** modal is displayed. Select any relevant **Groupings**, which will be expressed as additional columns in CSV exports and in the chart legend of PDF exports.
The columns can be any combination of groupings from the following list:
* Provider (e.g., AWS, GCP, New Relic)
* Service (e.g., EC2, EBS)
* Region (e.g., us-east-1)
* Service category (e.g., Storage, Compute)
* Service subcategory (e.g., m5.large, StandardTier)
* Charge Type (e.g., Usage)
* Account (e.g., AWS member account, GCP project)
* Billing Account (e.g., billing account name)
* Resource ID (e.g., S3 bucket ARN, MongoDB Atlas cluster name)
* Usage Unit (e.g., `GB-Mo`, `Hrs`)—adds a column for the unit of measure. This grouping is automatically selected when the report is in [usage view](/usage_based_reporting).
* Tag key, which will be included as an additional column in the export, in the following format: `Tag:` (e.g., `Tag:Project`).
For **File Format**, select **CSV**, **PDF**, or both.
Enter the email addresses that should receive the export. You can select existing Vantage users or enter any email address that belongs to your organization's verified domain.
The export email contains a link to download the report from the Vantage console, which requires signing in. Recipients who open the report must therefore be Vantage users. This makes it possible to send the export to a distribution list on your verified domain, as long as the people who ultimately download it have Vantage accounts.
Select a date range and date bin for the export.
For the **Date Bin** export option, when you select **Week**, the week in the export will begin on Monday, UTC. When you select **Month**, the month in the export will begin on the first of the month, UTC.
For the **Schema** option, select one of the following:
* **Vantage**: The default export schema.
* **FOCUS**: The [FinOps Foundation FOCUS](https://focus.finops.org/) schema.
* **Comparison**: Exports the current period, previous period, change (\$), and change (%) for each grouping. This option is only available when previous period comparison is enabled on the report.
If your Cost Report has an associated [business metric](/per_unit_costs), a separate toggle is displayed at the bottom of the export modal. This allows you to export unit costs alongside your cost data as a separate CSV file.
Click **Export**.
When the export is finished generating, you'll receive an email with a link to download the exported data from the Vantage console, typically within a few minutes. The link requires signing in to Vantage and expires after 90 days. Large date ranges may take longer.
If you select both PDF and CSV, you'll be sent a link to download a ZIP folder containing both files. All PDF exports come in the landscape orientation to optimize the layout of the chart.
## Frequently Asked Questions
A `$0` value for a previous month usually means cost data has not finished importing for that period. This can happen when a new integration is still backfilling historical data, or when an existing integration has entered an error state. Check your [integration status](/vantage_account#integration-status) to confirm all connected providers show a **Stable** status. If a provider shows **Importing**, it is still completing its initial data import. If a provider shows **Error** or **Warning**, review the integration settings to resolve the issue. See the [provider data refresh documentation](/provider_data_refresh) for expected refresh timing per provider.
Cost Reports compare the selected date range to the same previous period by default. If the comparison period had unusually high or low spending (such as a one-time purchase or a month with partial data), the current month's change percentage may appear misleading. Open the date picker and review the **Comparing to Previous Period** dates to confirm the comparison range is correct. You can also select a custom comparison period for a more accurate baseline.
Several settings affect how costs are calculated. Check the following on your Cost Report by clicking **Cost Settings** at the top:
* **Amortization**: When enabled, upfront payments (such as Reserved Instances) are spread across the commitment period. Your provider's console may show actual costs instead.
* **Credits, Discounts, Refunds, and Tax**: Vantage includes or excludes these based on your report settings. Toggle these options to match what your provider's billing console displays.
* **Data freshness**: Provider cost data refreshes on a schedule that varies by provider. See the [provider data refresh documentation](/provider_data_refresh) for expected timing.
Open the **Filters** menu on a Cost Report and add a **Category**, **Subcategory**, or **Resource** rule. By default, these filters are scoped to a specific service. To search across all services for a provider, select **All Categories**, **All Subcategories**, or **All Resources** from the filter dropdown. Filter values are case-sensitive.
Available values vary by provider. For example, AWS subcategories are usage type descriptors like `DataTransfer-Out-Bytes`, while Datadog subcategories distinguish `Commitment` from `On Demand`.
When you query costs with a `cost_report_token`, the API starts from that Cost Report's saved settings and applies any request-level overrides. By default, cost results aggregate by cost. If the saved Cost Report is configured to aggregate by usage and you want cost aggregation for a specific API request, pass `settings[aggregate_by]=cost`.
To drill into an unexpected increase, try the following:
1. On your Cost Report, add a **Group By** for **Resource** to identify which specific resources drove the spike.
2. Adjust the date bin to **Daily** to pinpoint the exact date the increase started.
3. For AWS networking costs, use [Network Flow Reports](/network_flow_reports) to investigate traffic patterns that may explain increases in services like NAT Gateway or data transfer.
A filter set that uses **All Providers** queries data from every connected provider, so it has more data to scan than a single-provider filter. Vantage still narrows the query to the relevant billing data for your organization, but you can keep these reports fast by:
* Adding specific filter rules (e.g., a particular account, service, or region) to reduce the amount of data scanned.
* Using exact-match operators (`is`, `is one of`) instead of partial-match operators (`contains`, `starts with`, `flexible match`) where possible.
* Creating one filter set per provider when you only care about two or three providers, rather than using **All Providers**.
## Starred By Me
If you want to save your favorite Cost Reports or [folders](/folders) to a convenient location, you can *star* specific resources.
From the [All Cost Reports](https://console.vantage.sh/reporting) screen, select the checkbox next to one or more Cost Reports.
Above the list, click **Star**. A star icon will be displayed next to the report.
To access all starred reports, navigate to the [**Starred By Me**](https://console.vantage.sh/reporting?starred=true) screen, also accessible from the left Reporting navigation pane.